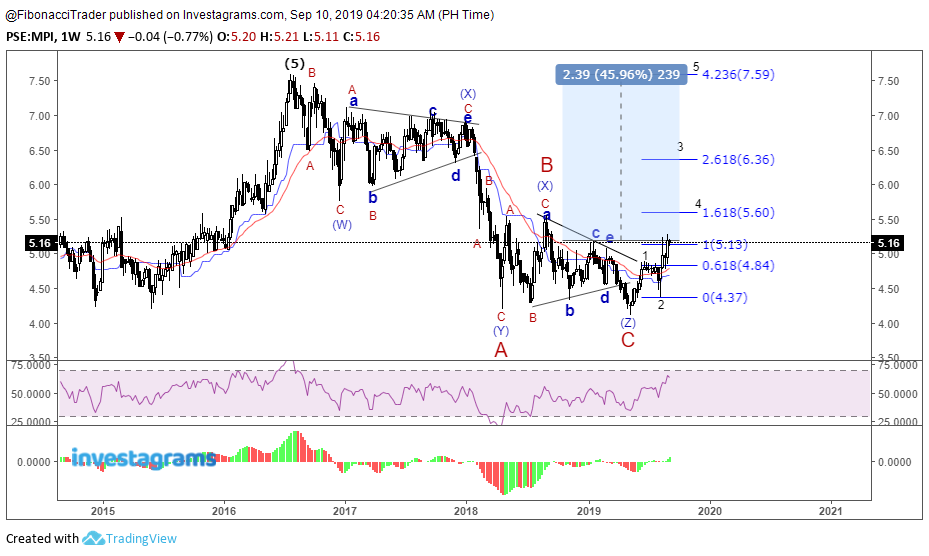
Metropacipic Investment Corporation (MPI) Completed ABC Correction As Triple Three and currently on Wave 3 Impulse with a possible target price at 5.60.
A Technical Analysis of the Financial Market Using Fibonacci, Elliott Wave, Andrew's Pitchfork, Ichimoku, Moving Average and Different Chart Patterns
Pages
Tuesday, September 10, 2019
Saturday, September 7, 2019
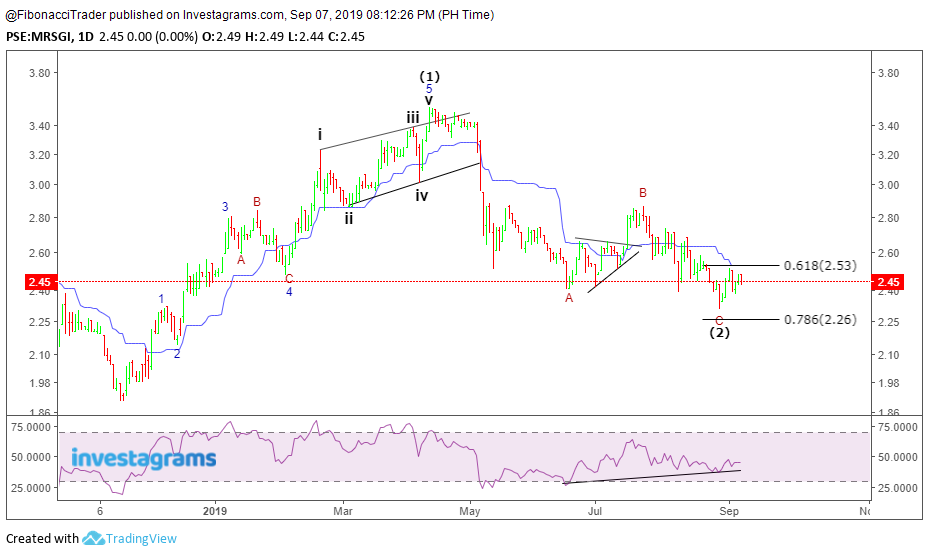
Metro Retail Stores Group (MRSGI) Completes 5-3 Wave Cycle
On April 10, 2019, the price of Metro Retail Stores Group (MRSGI) drew a five-wave rally with an ending diagonal in the position of wave 5. Naturally, a three-wave decline followed. The retracement developed as an A-B-C zigzag and dragged the price down to almost exactly the 78.6% Fibonacci Retracement.
Friday, August 30, 2019
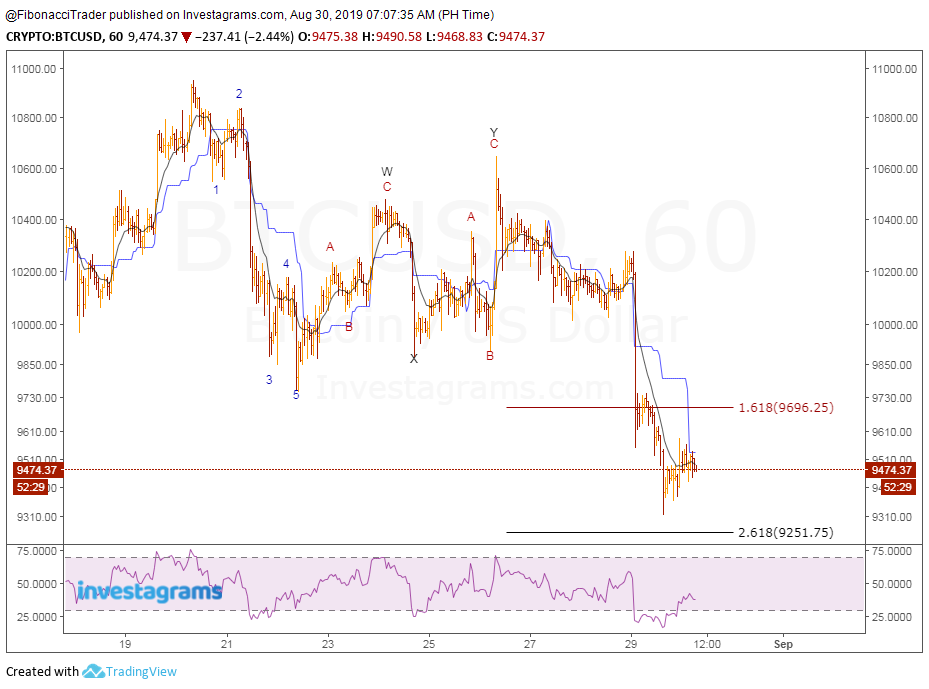
Bitcoin BTCUSD Completes 5-3 Cycle
The Elliott wave structure showed that the decline from $10, 955 to $9,755 was impulsive. It was labeled 1-2-3-4-5 and was followed by a W-X-Y Double Zigzag correction. Taken together, the impulse and the correction formed a complete 5-3 wave cycle pointing downwards.
Tuesday, August 27, 2019
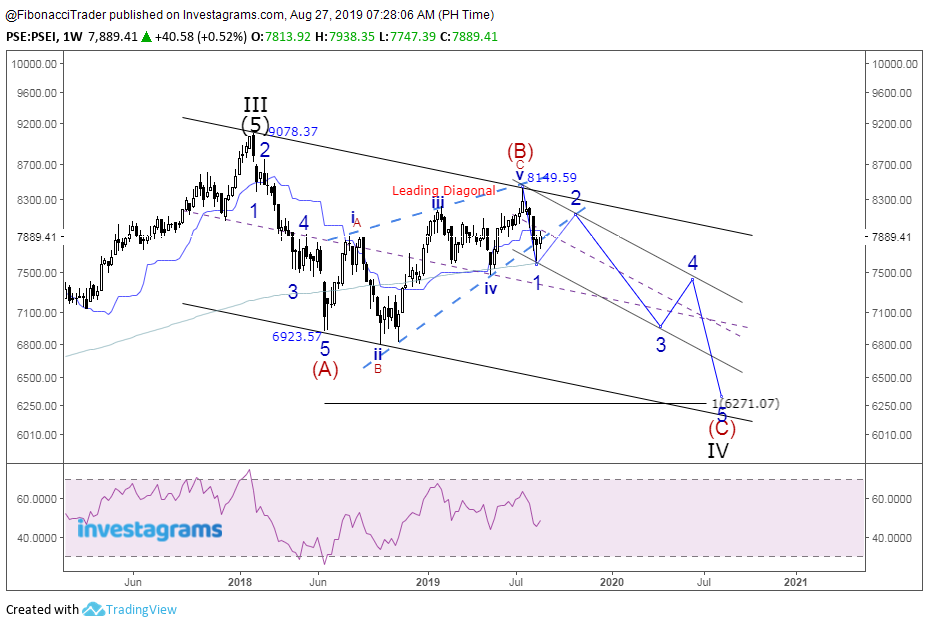
Philippine Stock Exchange Index (PSEi) ABC Zigzag Correction
Philippine Stock Exchange Index (PSEi) may be making the last corrective WAVE (C) on a 5-3-5 or ZigZag Correction. Wave (B) just completed with Leading Diagonal at 8419.59. Wave (C) which is the last leg of ABC Zigzag correction is unfolded and it seems that the first impulsive Wave 1 has ended and currently making Wave 2. Wave 2 may go up to 8000 levels and after that, it will go down to complete Wave (C). Wave (C) is forecasted to end at 6271. The time period to complete Wave (C) maybe around 2nd Quarter of 2020.
The iShares MSCI Philippines ETF (EPHE) ABC Correction
The iShares MSCI Philippines ETF (EPHE) seeks to track the investment results of a broad-based index composed of Philippines equities.
EPHE maybe making the last corrective WAVE C on a 5-3-5 or ZigZag. Wave B just completed with Leading Diagonal at 37.15. Wave C which is the last leg of ABC correction is unfolded and it seems that the first impulsive Wave 1 has ended and currently making Wave 2. Wave 2 may go up to 35 levels and after that, it will go down to complete the impulsive wave of Wave C. Wave 5 of Wave C is forecasted to end at 27. The time period to complete Wave C maybe around December 2019.
Monday, August 26, 2019
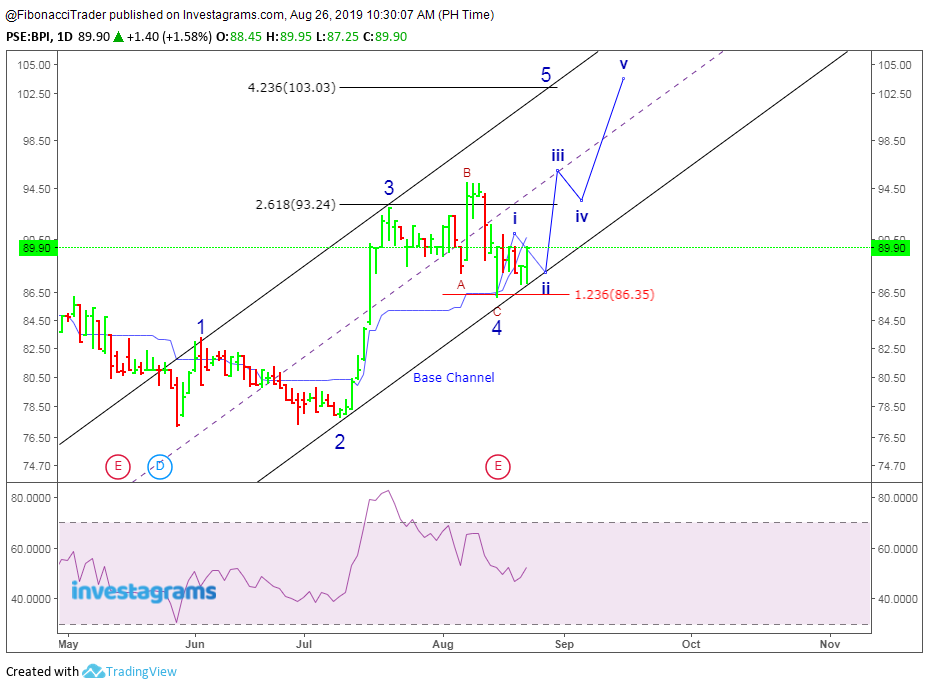
Bank of the Philippine Island (BPI) in a Expanded Flat Correction
The current Elliot Wave structure of Bank of the Philippine Island (BPI) suggest that it ended Expanded Flat Corrective waves. Down from 7/19/2019 high (93.00) Wave 3, wave A ended at (88.00) and wave B ended at (95.00). Wave C ended at 86.25 or 123.6% Fibonacci Extension. Is this the start of the last impulsive wave 5? Wave 5 forecast target is at 103.00.
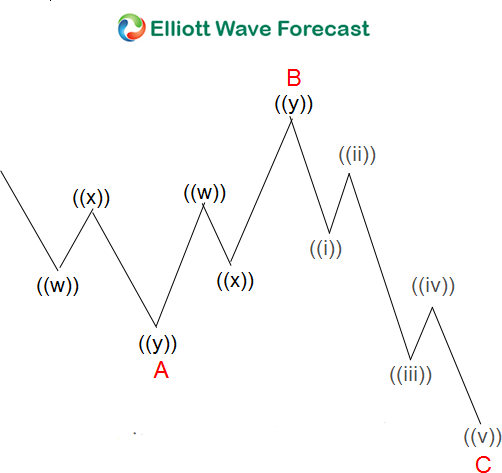
Expanded Flat is a 3 waves corrective pattern, and the inner subdivision is labeled as A, B, C with 3,3,5 structure. That means waves A and B are always corrective structures i.e. could be WXY, WXYXZ, Zigzag or any 3 waves corrective pattern. Wave C is either 5 waves impulse or ending diagonal pattern. In the graphic below, we can see what Expanded Flat structure looks like. Inner structure has ABC labeling, where wave B can complete below or above the starting point of wave A. Wave C should complete below the endpoint of wave A (usually at 1.236-1.618 Fibonacci extension A related to B).Sunday, August 25, 2019
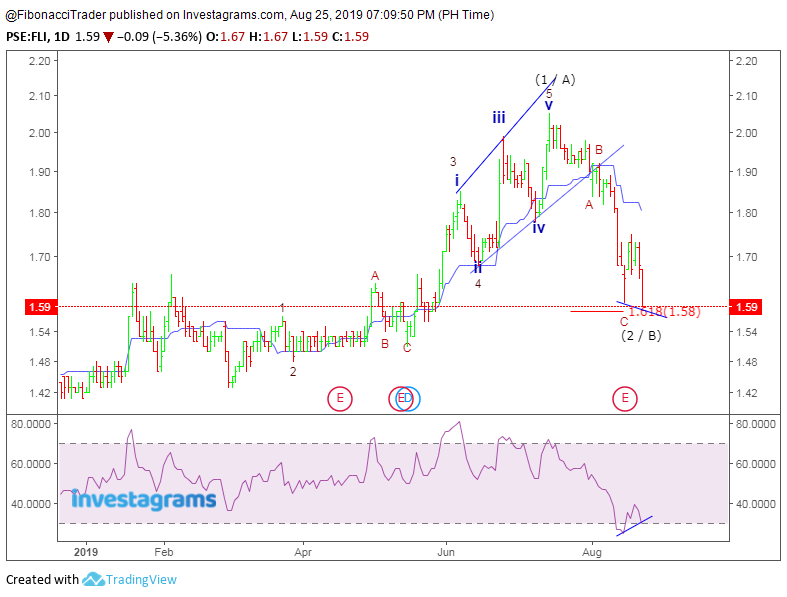
Filinvest Land, Inc. (FLI) Complete ABC Correction
On July 16, 2019, the price of Filinvest Land, Inc. (FLI) drew a five-wave rally with an ending diagonal in the position of wave 5. Naturally, a three-wave decline followed. The retracement developed as a simple A-B-C zigzag and dragged the price down to almost exactly the 161.8% Fibonacci Extention.
Wednesday, August 21, 2019
Jollibee Foods Corporation (JFC) Completes Wave A of a ZIGZAG or 5:3:5 Correction
Jollibee Foods Corporation (JFC) is a Philippines-based a company engaged in the development, operation and franchising of quick-service
restaurants (QSR) under the trade name Jollibee. The Company has a number of
subsidiaries, which include FRESH N' FAMOUS FOODS, INC., which develops,
operates and franchises quick-service restaurants under the trade names Chow King
and Greenwich; RED RIBBON BAKESHOP, INC. (through RRB HOLDINGS, INC.), which
develops, operates and franchises restaurants under the Red Ribbon trade name;
MANG INASAL PHILS., INC., which develops, operates and franchises restaurants
under the Mang Inasal trade name, and PERF RESTAURANTS INC., which franchises
restaurants under the Burger King trademark in the Philippines. It also has
subsidiaries and affiliates, which develop and operate it's international
brands, Yonghe King, Hong Zhuang Yuan, San Pin Wang, brands under the
SuperFoods Group (including Highlands Coffee and Pho 24), Sma and Dunkin'
Donuts. Recently JFC acquired Coffee Bean & Tea Leaf (CBTL) for $350M.
JFC just completed Wave A at 217.20 and is about to make Wave B. This means it is about to make a 3-wave bounce (Wave B) and will most likely make a lower low in its Wave C. It is following a Zigzag structure which is 5:3:5. The chart below shows how a Zigzag
looks like in the Elliott Wave Theory.
The low at 217.20 on August 13, 2019, ended Wave A of the
Corrective ABC of Elliott Wave. JFC may go up and make Wave B. Wave B may rise
up to 50% Fibonacci Retracement of Wave A or 270 – 280. Base on Elliott Wave the
Fibonacci Ratio of Wave B in Relationship with Wave A is Wave B = 50%, 61.8%,
78.6%, 88.6%.This suggests a Range Trade for JFC with downward Bias.
After Wave B, the last corrective Wave C may be unfolded and forecasted between 200 to 160 levels. The Fibonacci Ratio rules and guidelines for WAVE C is Wave C = 61.8%, 100.0 or 123.6% of Wave A.
Just to put things in a better perspective, JFC completed a multi-year 5-wave structure known in Elliott Wave as impulse waves. It will take at least the same number of years at a minimum to complete its ABC corrective phase. The impulse wave started in the first quarter of 2017 and end in the first quarter of 2019. Then there’s a probability that the Corrective ABC will end on the last quarter of 2020. I hope that idea is clear enough for everyone to understand.
Sunday, June 30, 2019
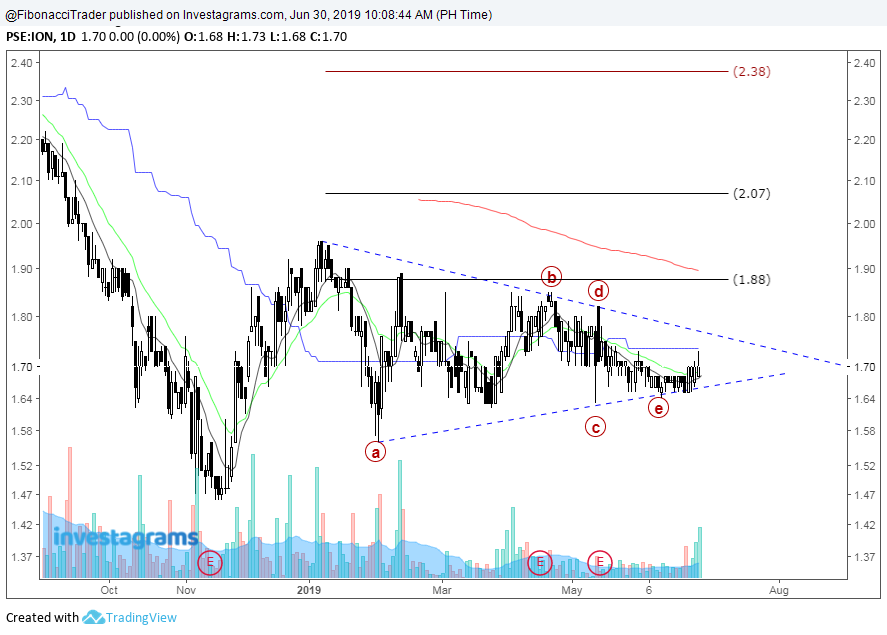
Ionics Inc., (ION) Consolidates Within a Symmetrical Triangle
It seems that ION is consolidating within a bullish symmetrical triangle. Buy on current prices or buy on Breakout of the Triangle. If the Traingle Breaks, initial target price is 2.07 then at 2.38. Support is seen at 1.60.
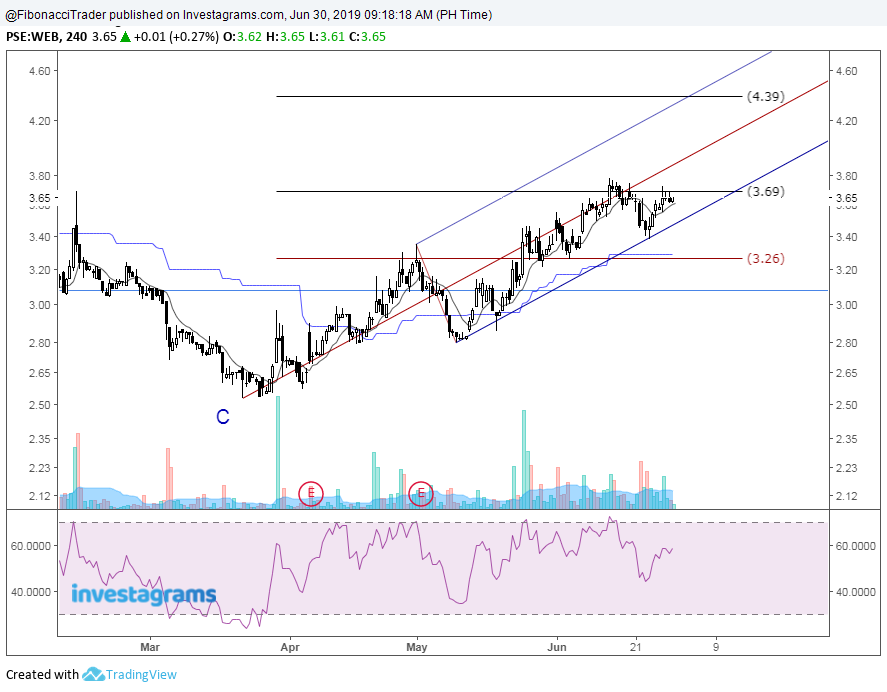
Philweb Corporation (WEB) Uptrend Intact, Bulls Watching for a Break Above 3.69
Looks like the Bulls are still in control, Philweb Corporation (WEB) Uptrend still intact. If 3.69 breaks, the initial target price is 4.39.
Saturday, June 29, 2019
A Case Study in PSE Stocks With Target Price
Let's us see if the target price of the following PSE stocks can reach their target within 3 months to 1.5 years.
Bitcoin BTCUSD Wave (1) Ends at 61.8% Fibonacci Ret. Level
Looks like BTCUSD (Bitcoin) wave 5 of the Larger Wave(1) finally ends at the 61.8% Fibonacci Retracement Level and may be making the corrective ABC or Wave (2) of the Larger Wave. Wave (2) might be between 9804, 8545 and 7285.
Monday, June 10, 2019
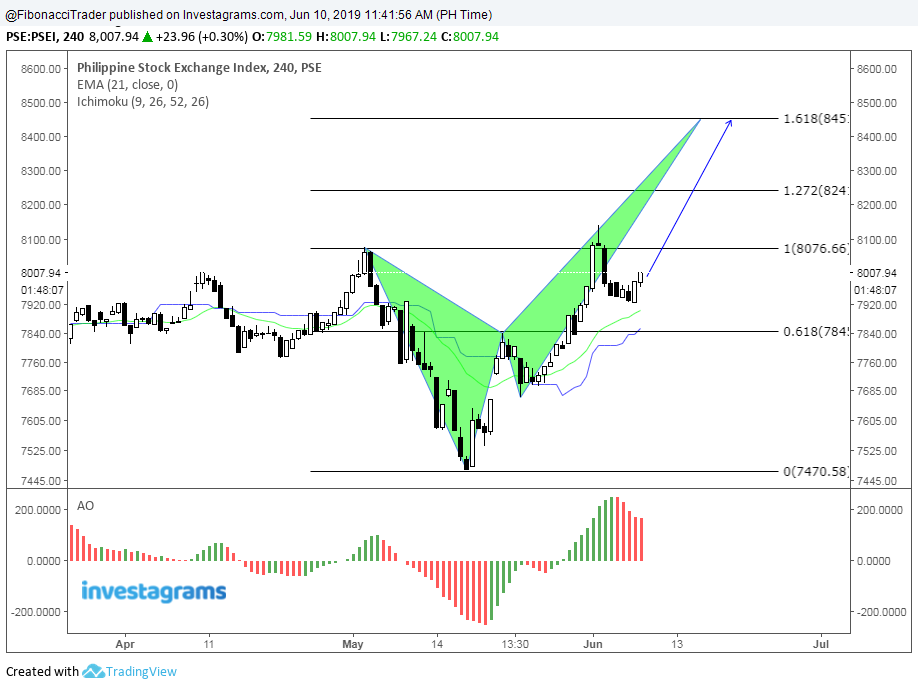
PSEI Could Reach 8450 Level
Looks like the index (PSEi) is currently making a Potential Bearish Crab that aims to be completed at 8450.
Sunday, June 9, 2019
WTI Crude Oil Elliot Wave ABC Correction
Looks Like WTI is currently making the corrective ABC of EW that aims to be completed between 53 tp 42 Level.
Saturday, June 8, 2019
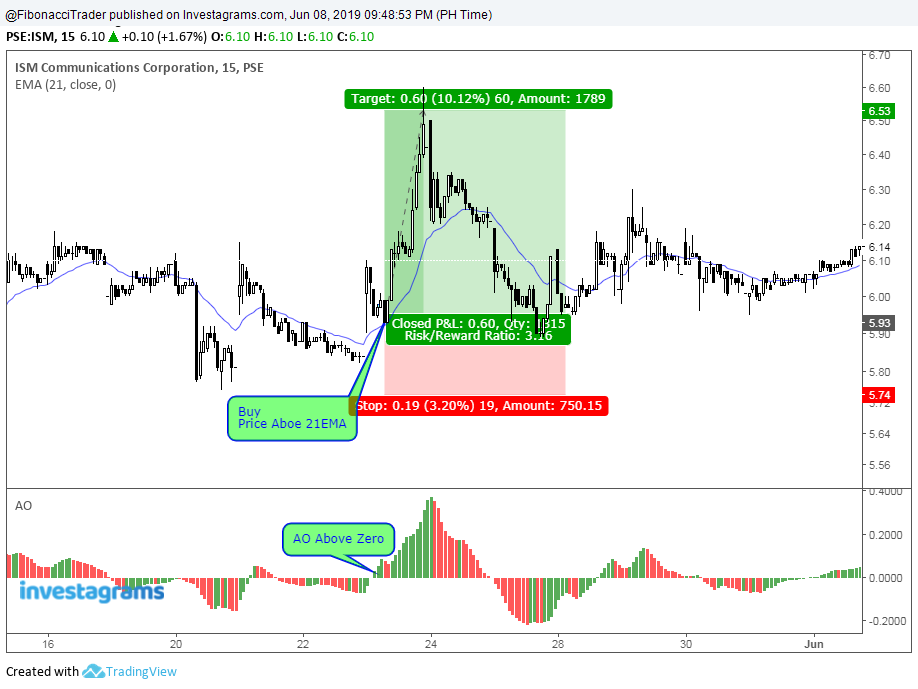
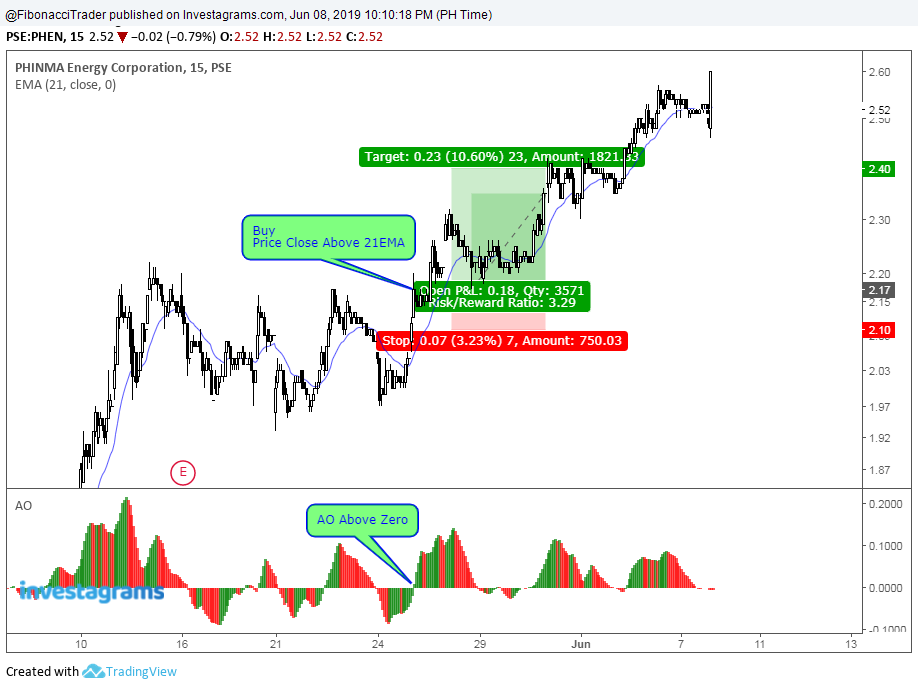
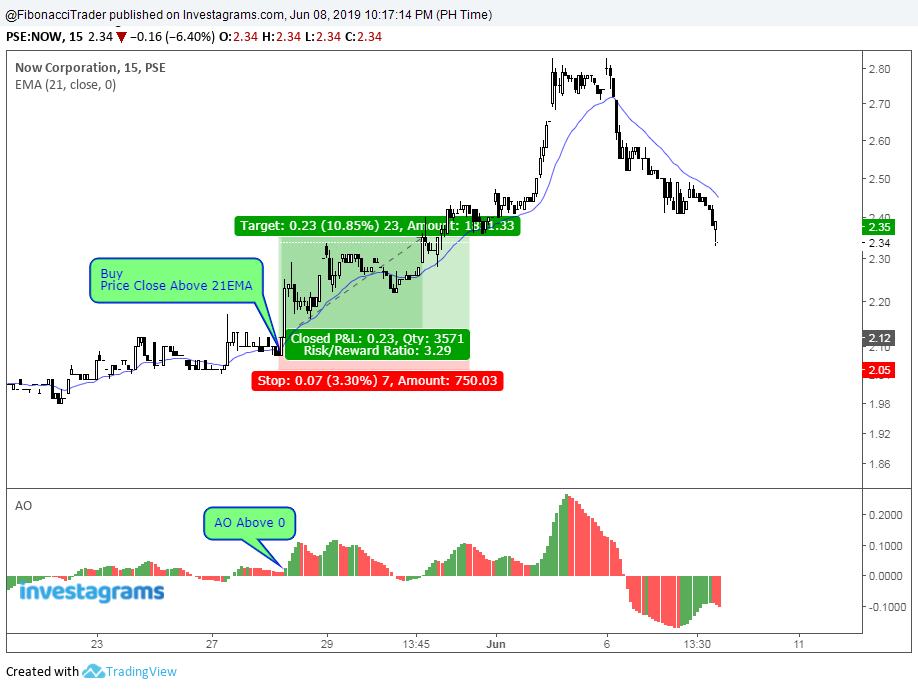
21 EMA & Awesome Indicator Strategy - Simple But it Works
Moving average is very effective in Stock market and in this strategy we have used 21 moving average with Awesome Oscillator. Both indicators indicate about market trend and help to identify trend direction easily. In this strategy, you will learn how can you find trading signals using 21 EMA(exponential moving average) and Awesome Indicator. This strategy can be used for both scalping and intraday.
Required Indicators
1. 21 EMA (put value 21)
2. Awesome Indicator
Buy Setup Rules
* First market price needs to cross 21 EMA from lower to upper.
* When 21 EMA upside breakout complete, then look at Awesome indicator
* At the same time, if Awesome Indicator stay above 0.0 level, then open buy entry.
* Set Stop Loss 3%.
* First market price needs to cross 21 EMA from lower to upper.
* When 21 EMA upside breakout complete, then look at Awesome indicator
* At the same time, if Awesome Indicator stay above 0.0 level, then open buy entry.
* Set Stop Loss 3%.
* Set Taret Price 10%.
Timeframes: 15Min, 30Min, 1 Hour
Note: This is for the Momentum Stocks Only
Examples
ISM Communications (ISM)
Phinma Energy Corporation (PHEN)
Now Corporation (NOW)
Sunday, May 5, 2019
Gold Wave 3 and Potential Bearish Butterfly - May 5, 2016
It seems that Gold completed Wave 3 and might retest 1275.50. Gold is also forming a potential Bearish Butterfly that aims to be completed at 1292.70 which is in confluence with the end of Wave 5.
NZDUSD Potential Bearish Bat - May 5, 2019
It seems that NZDUSD is currently forming a Potential Bearish Bat that aims to be completed at 0.6750-70 area.
Sunday, April 21, 2019
USDCAD Potential Bearish Bat
It seem's that USDCAD is currently making a potential Bearish Bat that aims to be competed at 1.3595.
Thursday, February 14, 2019
A Case Study in PSE Stocks With Target Price
Let's us see if the target price of the following PSE stocks can reach their target within 3 months to 1.5 years.
Tuesday, January 1, 2019
Why I am Bullish on Philippine Stock Market this 2019
My reasons why the Philippine Stock Market is Bullish this year 2019.
Technical Analysis
> Monthly Chart - Looks like the Lower Trendline of the Uptrend Channel was respected for the third time. There is a rule in Technical Analysis that states it takes at least two bottoms to draw a valid trend line but it takes THREE to confirm a trend line.
> Daily Chart - It seems that the index is consolidating on a triangle pattern (3-3-3-3-3). If we break 7,600 level the PSE index might trade within the range of 8,000 to 8900 level for 2019.
Fundamental Analysis
> The uptrend will be supported by Lower Inflation Rate on 2019. The main catalyst for this is the continuous declined of oil prices in the World Market. According to BSP the Inflation Rate Forecast for 2019 is 3.5%. (Source: https://business.mb.com.ph/2018/12/02/bsp-sees-lower-2019-inflation/)
>The economy will grow 6.7% . (Source: https://www.reuters.com/article/us-philippines-economy-imf/imf-sees-philippines-gdp-growth-at-6-7-percent-in-2018-2019-idUSKBN1KF0A2?il=0)
Subscribe to:
Comments (Atom)
