Tuesday, August 28, 2018

Philippine Stock Exchange Index (PSEi) Projected to Reach 8070

Looks like  the PSEi gonna reach the initial target of wave v at 8070 by the end of the 3rd quarter.
Immediate support at 7700 and resistance at 7800.


Thursday, August 9, 2018

A Case Study PSE Stocks With Target Price

Let's us see if the target price of the following PSE stocks can reach their target within 1 to 3 months.


DISCLAIMER
 As always, it is essential that anyone using my analysis for trading advice manages risk carefully. Trading is about probabilities, not certainties. Accept that my analysis may be wrong. It is impossible for any analyst to predict with certainty what a market will do next.

Technical Analysis For Forex, Cryptocurrency and Stocks.
No Hype ... No Tsismis ... No Drama .... Just Chart !!!!
Please Join My Discord Channel : https://discord.gg/c7r4RBU

Chart Paint Louder Than Words No. 7 - Bitcoin / US Dollar (BTC/USD)

Chart Paint Louder Than Words No. 9 - August 9, 2018
Cryptocurrency
Bitcoin / US Dollar (BTC/USD)
Last Price: 6357


Technical Analysis:
- Trendline Retest

Trading Plan:
- Recommendation : Buy at Current Price or Lower
- Target Price (1 - 8,800
) (2- 10,500) (3 - 13,200)
- Stop Loss : Below 5600
- Resistance levels are at 6875, 7500 and 8100.
- Support levels are  at 6250, 5900 and 5600.


DISCLAIMER
 As always, it is essential that anyone using my analysis for trading advice manages risk carefully. Trading is about probabilities, not certainties. Accept that my analysis may be wrong. It is impossible for any analyst to predict with certainty what a market will do next.

Technical Analysis For Forex, Cryptocurrency and Stocks.
No Hype ... No Tsismis ... No Drama .... Just Chart !!!!
Please Join My Discord Channel : https://discord.gg/c7r4RBU

Tuesday, August 7, 2018

Chart Review - Philipppine Stock Exchange Index (PSEi) and the 161.8% Golden Ratio

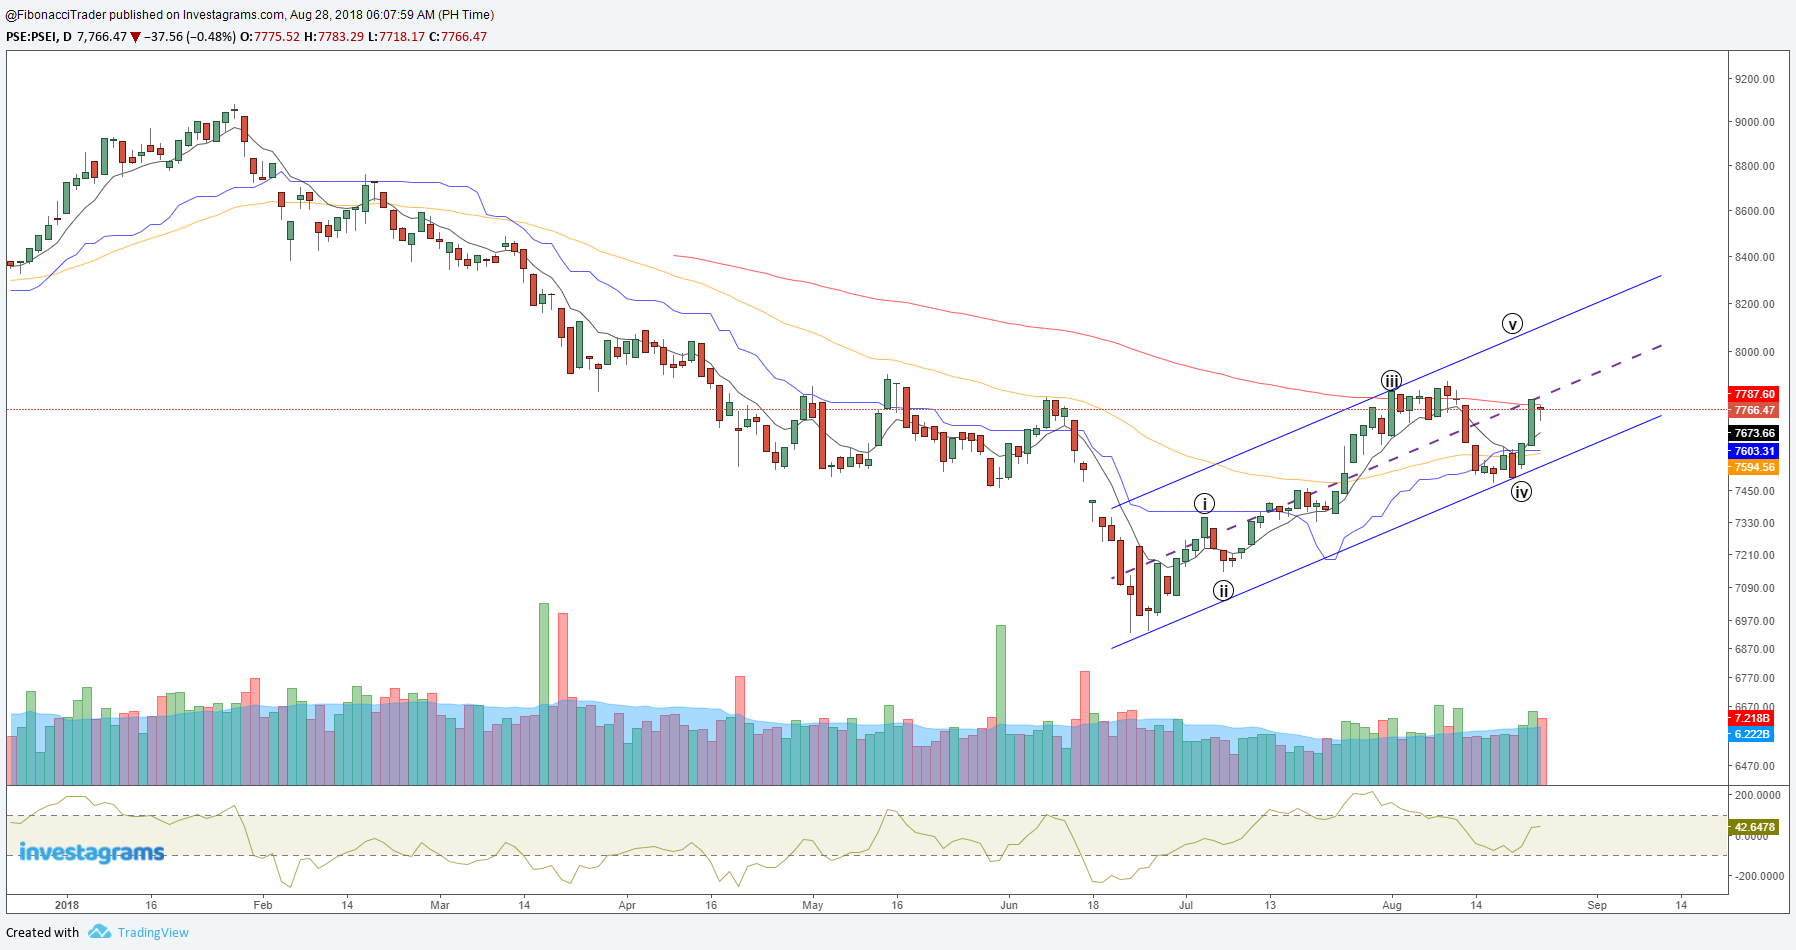
The Philipppine Stock Exchange Index (PSEi) is down today by -91.46 points or -1.17%. As per Technical Analysis the index just respected the 161.8% Golden Ratio. If we don't go back above 8 EMA on the coming days  we might retest  7,500and if we stay above 7,500 level the index might go back to 8,000 level this year.

Support levels are at  7,656 and 7,500.

Resistance is seen at 7,800.


Technical Analysis For Forex, Cryptocurrency and Stocks.
No Hype ... No Tsismis ... No Drama .... Just Chart !!!!

Please Join My Discord Channel : https://discord.gg/c7r4RBU

Monday, August 6, 2018

Chart Review - What Happen why TBGI went Down?

I will explain it through Technical Analysis

1. Completed a Bearish Alternate 161.8% ABCD (Respected The 161.88% Golden Ratio)

2. There is a Bearish Divergence between the indicator (CCI)  and the price.

3. It might retest the Neckline of the Cup and Handle which is 80% happen after breakouts.

This just a normal retracement and I think it's an oppurtunity to buy at lower prices.


Technical Analysis For Forex, Cryptocurrency and Stocks.
No Hype ... No Tsismis ... No Drama .... Just Chart !!!!
Please Join My Discord Channel : https://discord.gg/c7r4RBU


Chart Paint Louder Than Words No. 6 - MRC Alied, Inc. (MRC)

Chart Paint Louder Than Words No. 6 - August 6, 2018

Stocks
MRC Allied, Inc. (MRC)
Last Price: 0.65


Technical Analysis:
- Breakout Symmetrical Triangle

Trading Plan:
- Recommendation : Buy at Current Price or Lower
- Target Price (1 - 0.78
) (2- 0.98 ) (3 - 1. 17)
- Stop Loss : Below .58
- Resistance levels are at 0.68, .78, 0.88
- Support levels are  at .60 and .58


DISCLAIMER
 As always, it is essential that anyone using my analysis for trading advice manages risk carefully. Trading is about probabilities, not certainties. Accept that my analysis may be wrong. It is impossible for any analyst to predict with certainty what a market will do next.

Technical Analysis For Forex, Cryptocurrency and Stocks.
No Hype ... No Tsismis ... No Drama .... Just Chart !!!!
Please Join My Discord Channel : https://discord.gg/c7r4RBU

Sunday, August 5, 2018

Chart Paint Louder Than Words No. 5 - Petroenergy Resources Corporation (PERC)

Chart Paint Louder Than Words No. 5 - August 5, 2018

Stocks
Petroenergy Resources Corporation
Last Price: 4.17


Technical Analysis:
- Completed a Bullish Butterfly Harmonic Pattern

Trading Plan:
- Recommendation : Buy at Current Price or Lower
- Target Price (1 - 4.26) (2-5.22 ) (3 - 5.98)
- Stop Loss : Below 4
- Resistance levels are at 4.50 and 5
- Support is seen at 4


Technical Analysis For Forex, Cryptocurrency and Stocks.
No Hype ... No Tsismis ... No Drama .... Just Chart !!!!
Please Join My Discord Channel : https://discord.gg/c7r4RBU

Friday, August 3, 2018

ATN Holdings , Inc. (ATN) Wave 3 Extended Target Reached

Looks like the target price for ATN Holdings , Inc. (ATN) Wave 3 Extended Target  Reached at 1.22. Waiting for Wave 4 between 0.70 - 0.80.


Technical Analysis For Forex, Cryptocurrency and Stocks.
No Hype...No Tsismis... No Drama.... Just Chart!!!!
Please Join My Discord Channel : https://discord.gg/c7r4RBU

Philippine Stock Exchange Index (PSEi) - Cup and Handle Target Reached

The Philippine Stock Exchange Index (PSEi) has reached the Target Price  of the  Cup and Handle. Support levels are at  at 7656 and 7500. Resistance is seen at 7812.

The CCI shows that its already on Overbought Level.


Technical Analysis For Forex, Cryptocurrency and Stocks.
No Hype...No Tsismis... No Drama.... Just Chart!!!!
Please Join My Discord Channel : https://discord.gg/c7r4RBU

Thursday, August 2, 2018

Dow Jones Industrial Average (DJI) Looks Toppish

It seems that Dow Jones Industrial Average (DJI) looks toppish and the presence of bearish divergence signals weakness. Support is seen at 25,000 and resistance at 25,390.