Showing posts with label Bullish Butterfly. Show all posts
Showing posts with label Bullish Butterfly. Show all posts
Sunday, September 23, 2018
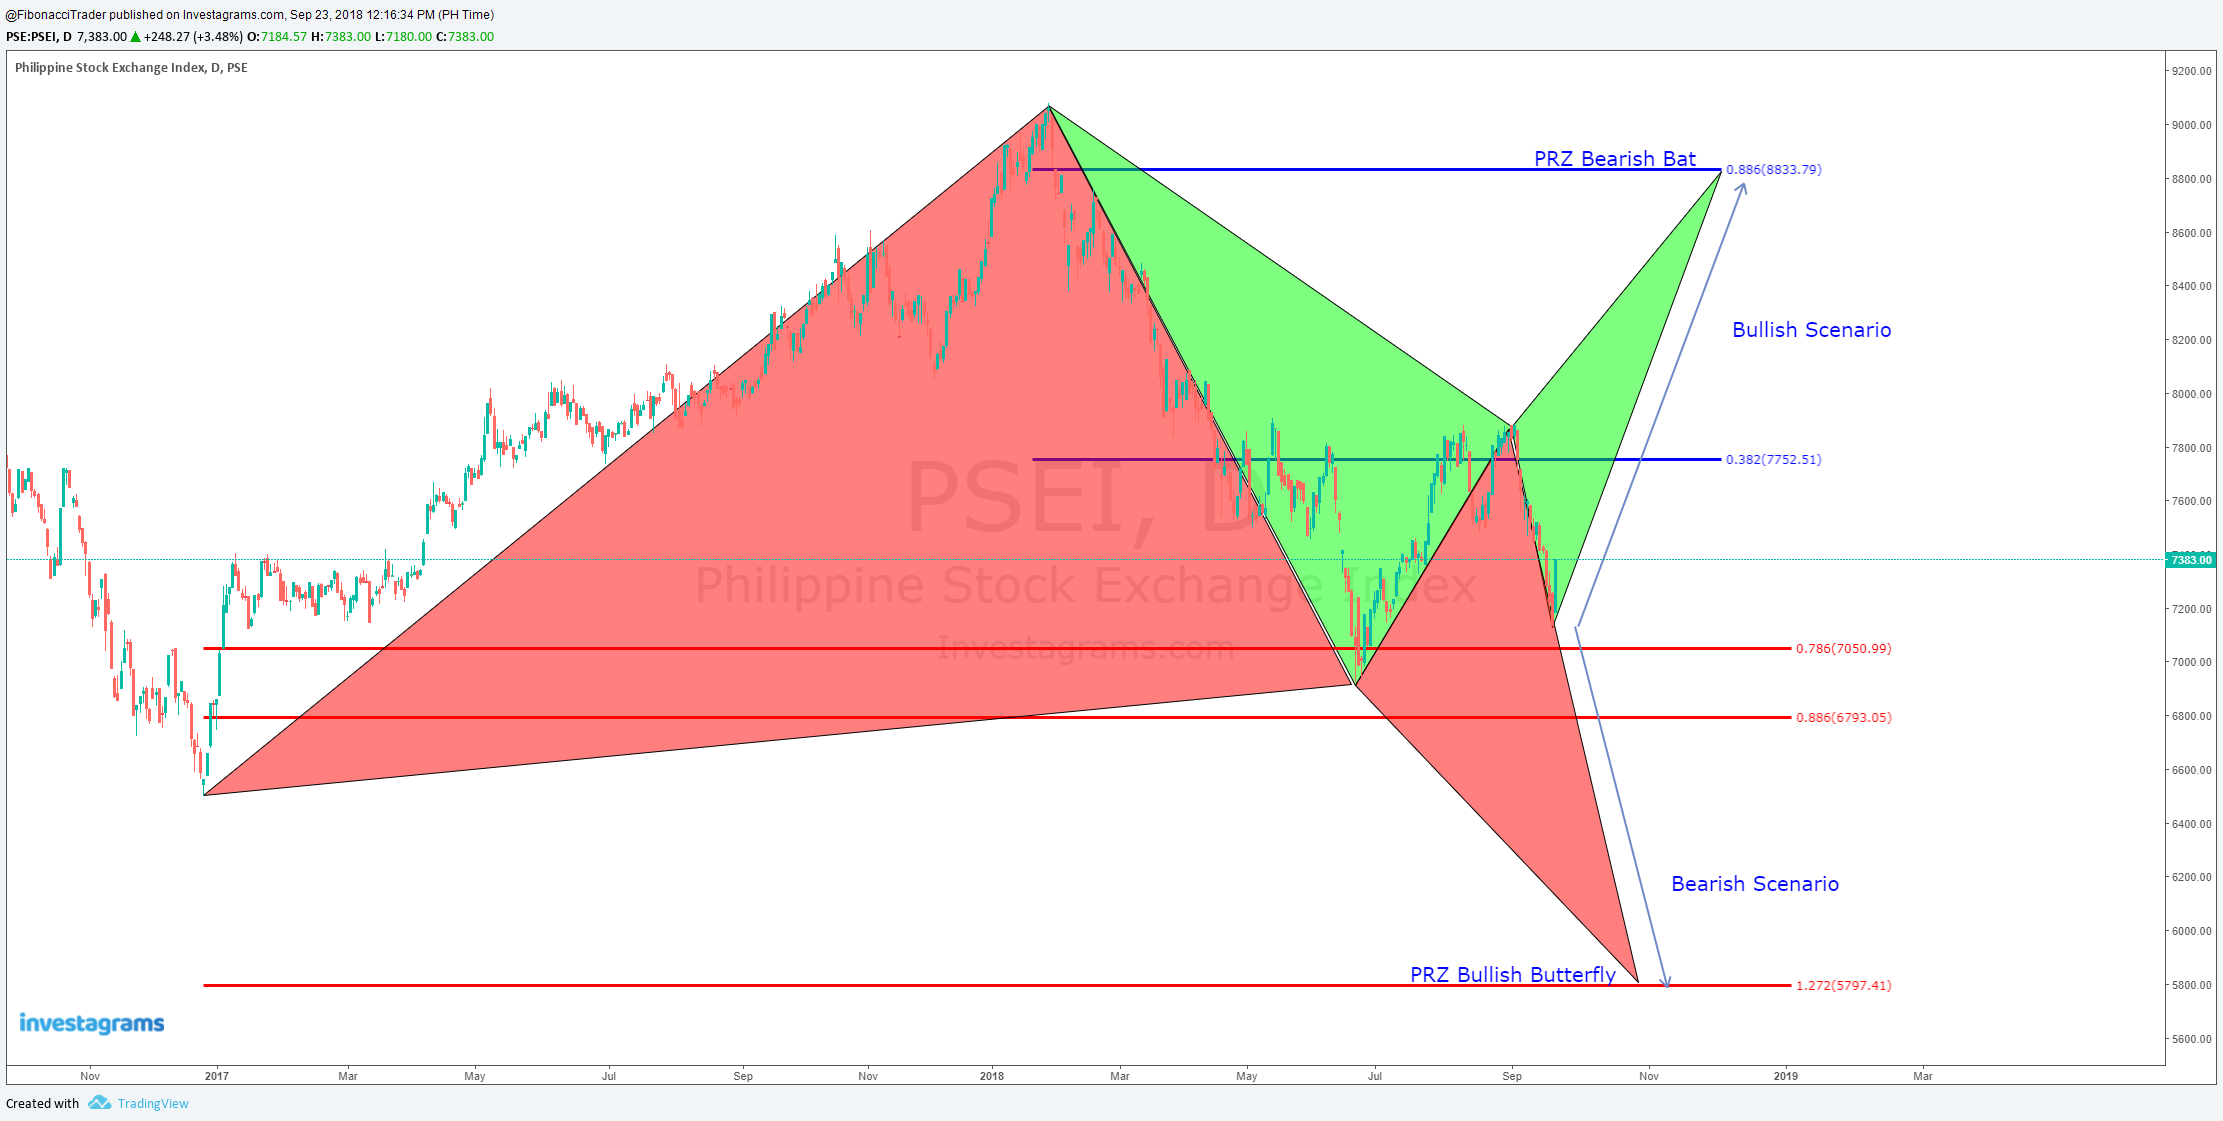
Philippine Stock Exchange Index (PSEi) Bullish and Bearish Scenario
The Philippine Stock Exchange Index (PSEi) may be forming a Potential Bullish Butterfly (Bearish Scenario) that aims to be completed at 5797 and a Potential Bearish Bat (Bullish Scenario) with Potential Reversal Zone at 8833.

Sunday, August 5, 2018
Chart Paint Louder Than Words No. 5 - Petroenergy Resources Corporation (PERC)
Chart Paint Louder Than Words No. 5 - August 5, 2018
Stocks
Petroenergy Resources Corporation
Last Price: 4.17

Stocks
Petroenergy Resources Corporation
Last Price: 4.17
Technical Analysis:
- Completed a Bullish Butterfly Harmonic Pattern
- Completed a Bullish Butterfly Harmonic Pattern
Trading Plan:
- Recommendation : Buy at Current Price or Lower
- Target Price (1 - 4.26) (2-5.22 ) (3 - 5.98)
- Stop Loss : Below 4
- Resistance levels are at 4.50 and 5
- Support is seen at 4
- Recommendation : Buy at Current Price or Lower
- Target Price (1 - 4.26) (2-5.22 ) (3 - 5.98)
- Stop Loss : Below 4
- Resistance levels are at 4.50 and 5
- Support is seen at 4

Technical Analysis For Forex, Cryptocurrency and Stocks.
No Hype ... No Tsismis ... No Drama .... Just Chart !!!!
Please Join My Discord Channel : https://discord.gg/c7r4RBU
Saturday, April 14, 2018
Universal Robina Corporation (URC) : Chart Hints at Further Downside - April 14, 2018
Looks like Universal Robina Corporation (URC) is forming a Potential Bullish Butterfly that aims to be completed at 119 level. Fifty Moving Average is already below two hundred Moving Average (Death Cross) showing sign of bearishnes. Resistance is seen at 147 and support at 140.
Recommendation : Sell/Avoid

Recommendation : Sell/Avoid

Technical Analysis For Forex, Cryptocurrency and Stocks.
No Hype...No Tsismis... No Drama.... Just Chart!!!!
Join FB Group Here: https://www.facebook.com/groups/155055288511760/
Saturday, February 3, 2018
BTCUSD Bullish Butterfly - February 3, 2018
BTCUSD completed a Bullish Butterfly Harmonic Pattern and may be forming a Descending Broadening Wedge Pattern..
Buy on current price.
Target 1 - 9,698
Target 2 - 10,979
Target 3 - 13,052
Cut loss below 6,850.
Caveat.

Buy on current price.
Target 1 - 9,698
Target 2 - 10,979
Target 3 - 13,052
Cut loss below 6,850.
Caveat.

Sunday, October 2, 2016
Deutsche Bank AG NA ON (DBK.DE) - Potential Bullish Butterfly - October 2, 2016
Deutsche Bank AG NA ON (DBK.DE) is seems to be forming a Potential Bullish Butterfly with PRZ at BC Projection at 7.90 and XD at 2.52.


Tuesday, June 7, 2016

Subscribe to:
Posts (Atom)