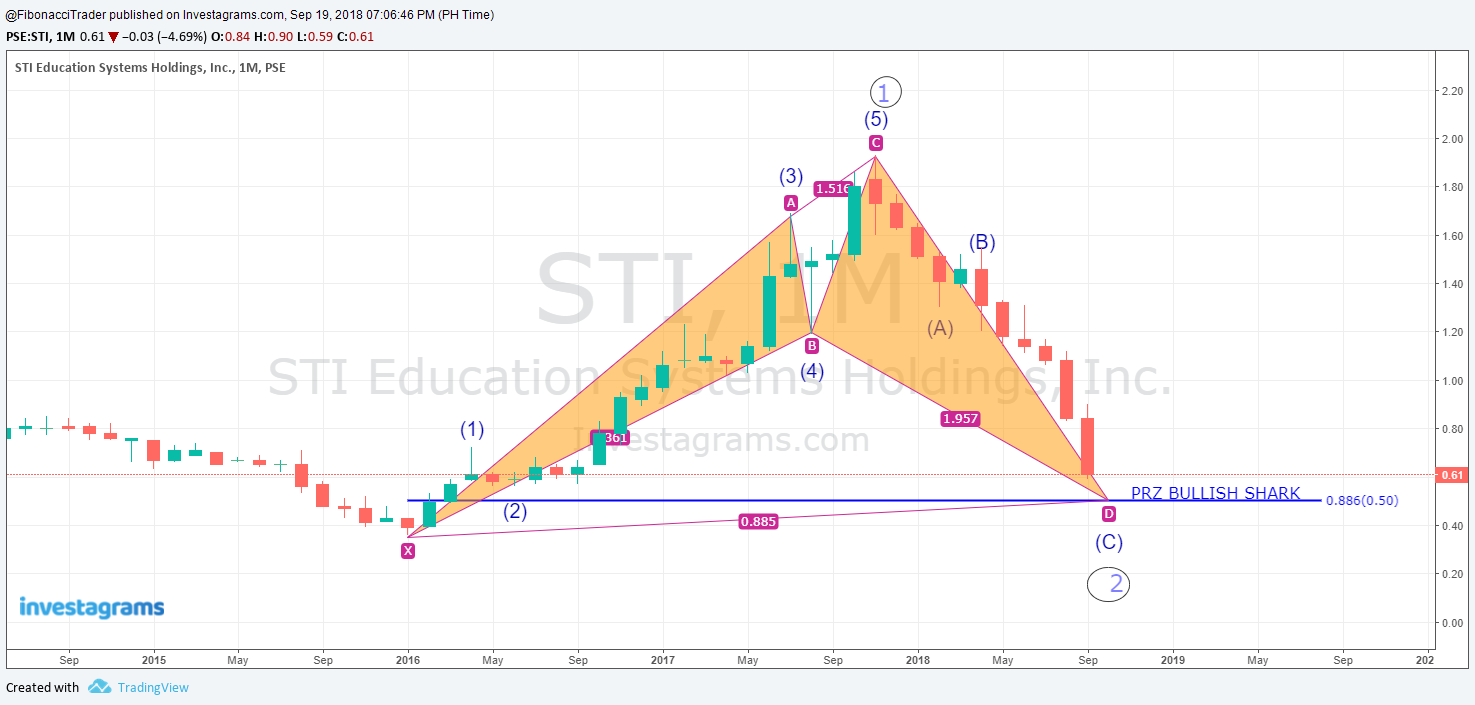
STI Education Systems Holdings, Inc. (STI) respected the Potential Reversal Zone of a Bullish Cypher Harmonic Pattern. STI also completed the Wave C of the corrective ABC of Elliot Wave.
Profit target 1 at 1.10 then at 1.42.
Looks like the Wave C of the corrective ABC of Elliot Wave is about to end at 0.50 level which is also in confluence with the Potential Reversal Zone (PRZ) of a Bullish Shark Harmonic Pattern.
•STI Education System Holding, Inc. (STI) dropped after the Minor Bullish Trendline & 21 Exponential Moving Average failed to hold as support.
•Sell/Avoid. Countertrend traders may try to buy on oversold levels and try selling on a rebound.
•The 21 Exponential Moving Average will now serve as resistance. Support is seen at 1.