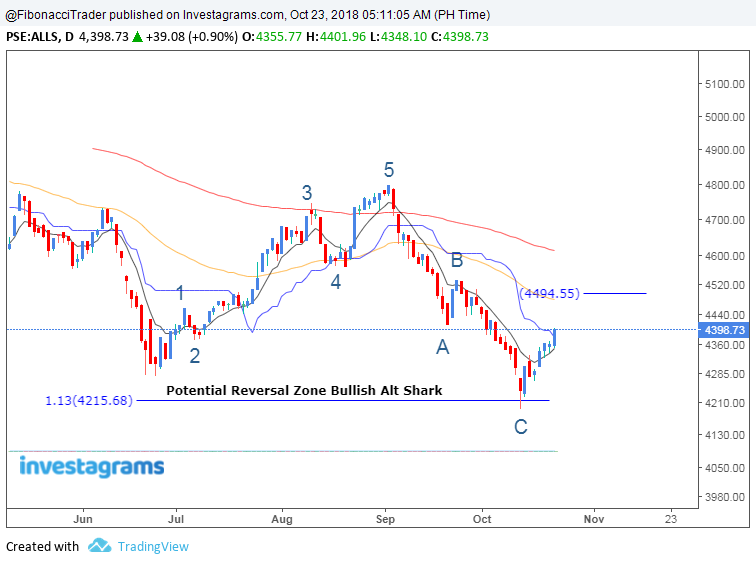
It seems that the All Shares Index completed the ABC correction of Elliot Wave in confluence with the completion of a Bullish Alt Shark Harmonic Pattern. All Shares Index needs to break 4495 to negate the downtrend.
Refer to my previous analysis : http://www.fibonaccitrader618.com/2018/10/all-shares-index-potential-bullish-shark.html
A Technical Analysis of the Financial Market Using Fibonacci, Elliott Wave, Andrew's Pitchfork, Ichimoku, Moving Average and Different Chart Patterns
Pages
Showing posts with label All Shares Index. Show all posts
Tuesday, October 23, 2018
Wednesday, October 10, 2018
All Shares Index Potential Bullish Shark
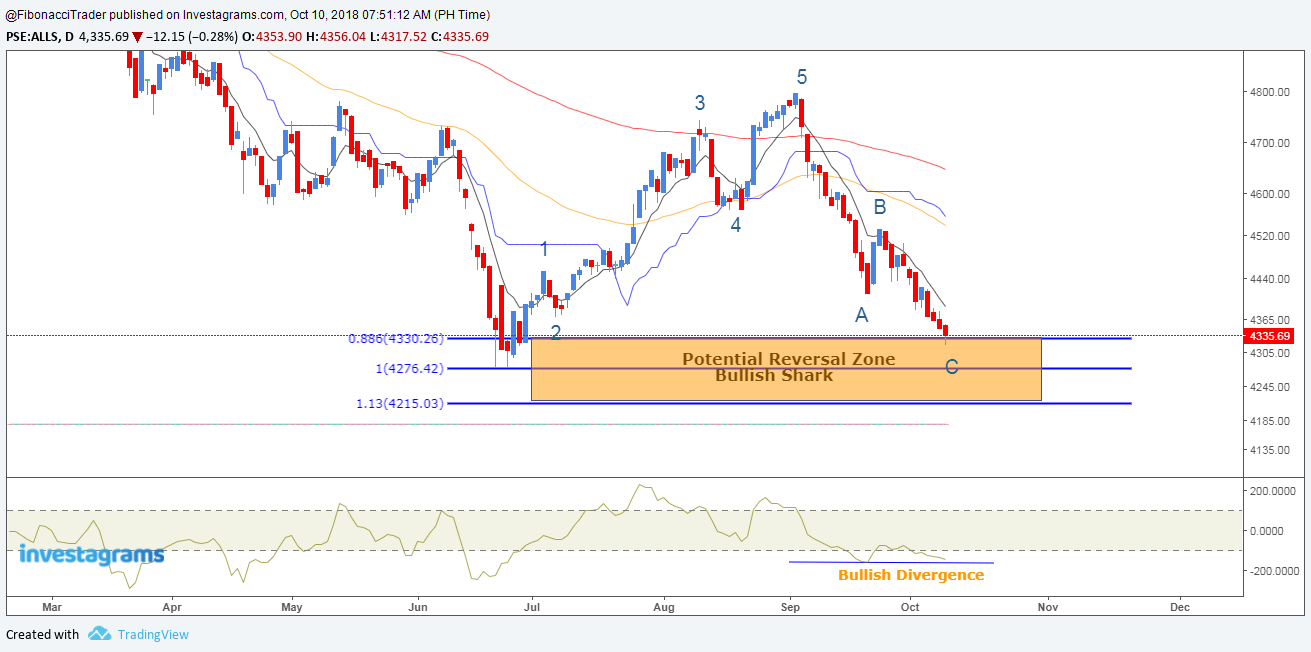
It seems that All Shares Index is currently making a Potential Bullish Shark that aims to be completed between 4215 to 4330 level. This is also in confluence with the final wave C of the Corrective ABC of Elliot wave.
Friday, January 26, 2018
All Shares Index Potential Bearish Alt 161.8% ABCD - January 26, 2018
All Shares Index is currently making a Potential Bearish Alt 161.8% ABCD
that aims to be completed at 5678.
Support is seen at 5200.
that aims to be completed at 5678.
Support is seen at 5200.
Sunday, November 20, 2016
Saturday, October 1, 2016
Subscribe to:
Posts (Atom)