Showing posts with label Bullish Divergence. Show all posts
Showing posts with label Bullish Divergence. Show all posts
Wednesday, October 31, 2018
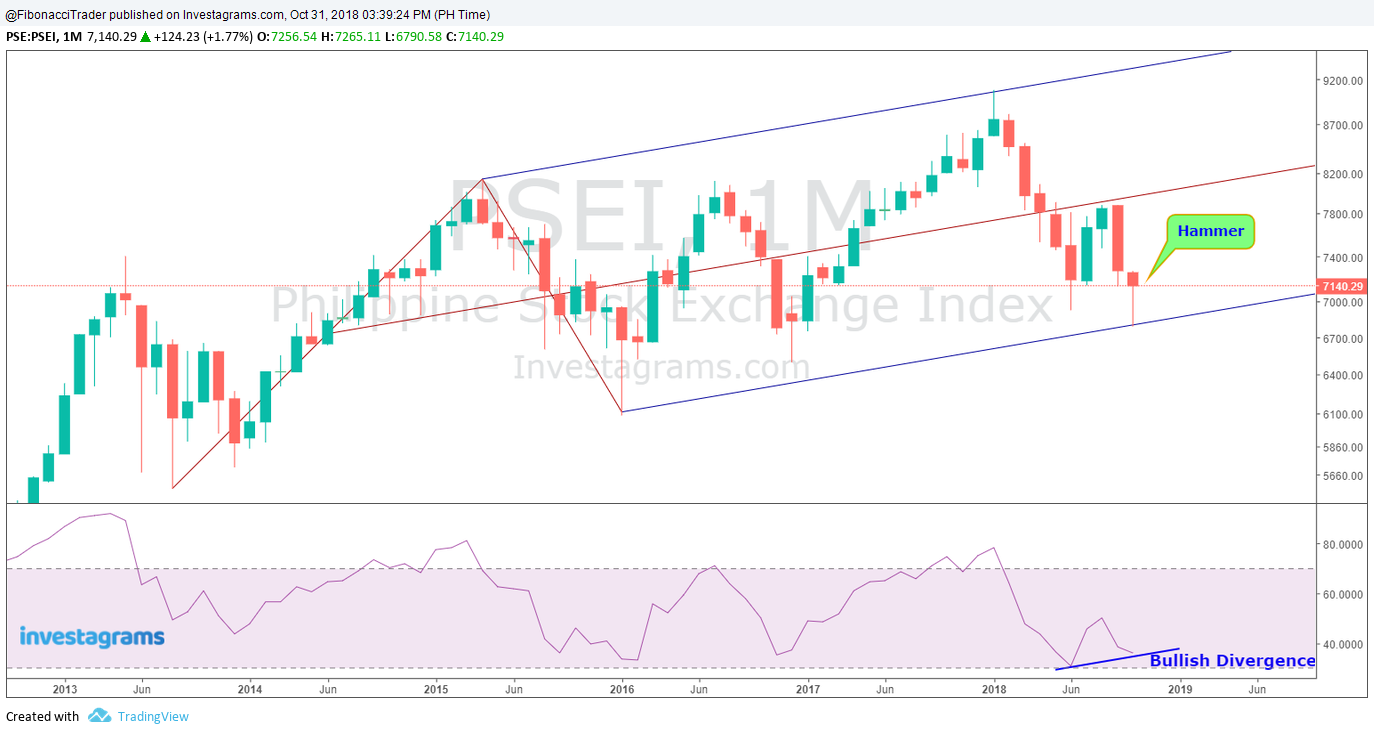
Philippine Stock Exchange Index (PSEi) It's Hammer Time
The Philippine Stock Exchange Index (PSEi) Monthly Chart closed with Bullish Hammer candle stick pattern.

Sunday, May 6, 2018
Philippine Stock Exchange Index (PSEi) Bullish Divergence - May 6, 2018
Looks like the Philippine Stock Exchange Index (PSEi) is going to rise next week. Tehnically there is a Bullish Divergence between the Price and Relative Strenght Index ( RSI).
Support is seen at 7500. Resistance levels are at 7618.,7737 and 7796.

Support is seen at 7500. Resistance levels are at 7618.,7737 and 7796.
Technical Analysis For Forex, Cryptocurrency and Stocks.
No Hype...No Tsismis... No Drama.... Just Chart!!!!
Join FB Group Here: https://www.facebook.com/groups/155055288511760/
Subscribe to:
Posts (Atom)