Showing posts with label BTCUSD. Show all posts
Showing posts with label BTCUSD. Show all posts
Friday, August 30, 2019
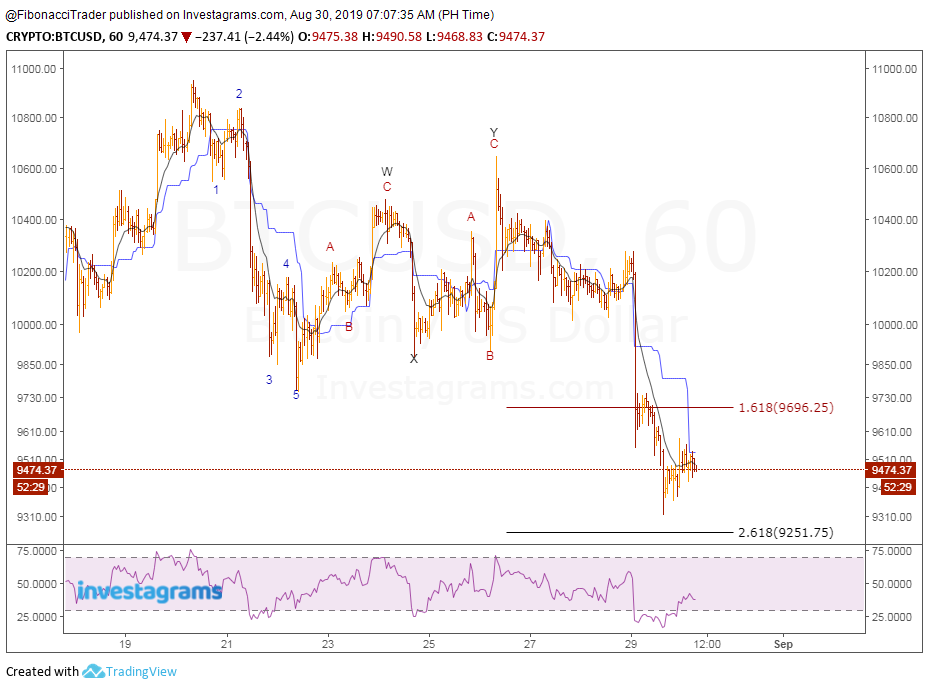
Bitcoin BTCUSD Completes 5-3 Cycle
The Elliott wave structure showed that the decline from $10, 955 to $9,755 was impulsive. It was labeled 1-2-3-4-5 and was followed by a W-X-Y Double Zigzag correction. Taken together, the impulse and the correction formed a complete 5-3 wave cycle pointing downwards.

Saturday, December 22, 2018
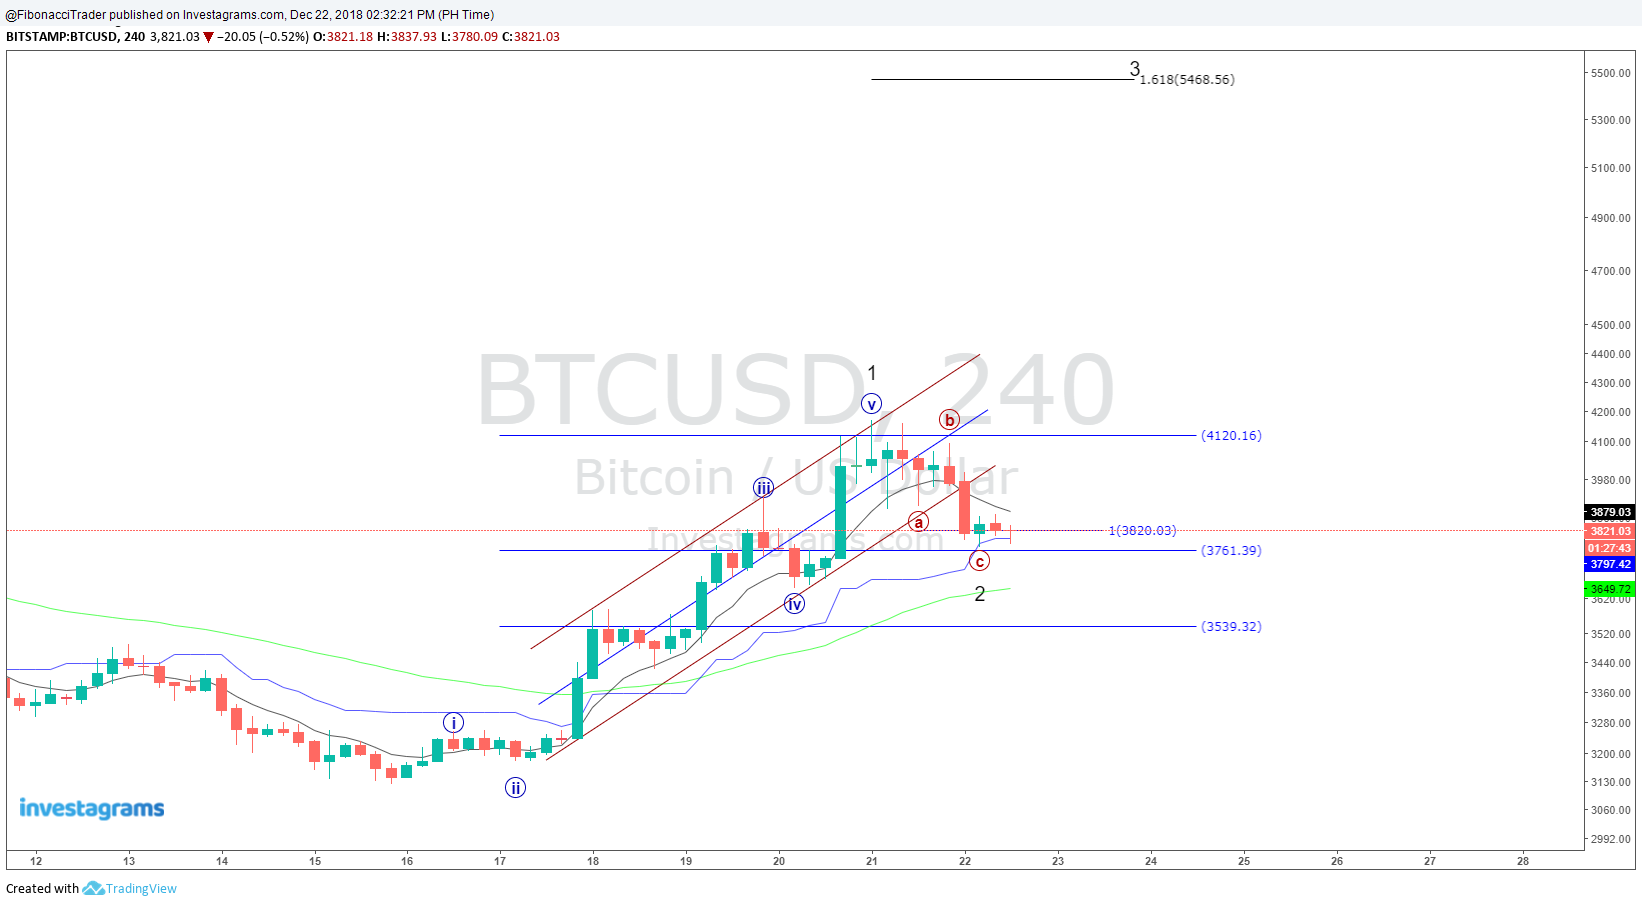
Bitcoin / US Dollar (BTCUSD) WAVE 3?
Looks like Bitcoin / US Dollar (BTCUSD) is going to make the impulse wave 3 with a possible target at 5468.
Sunday, November 25, 2018
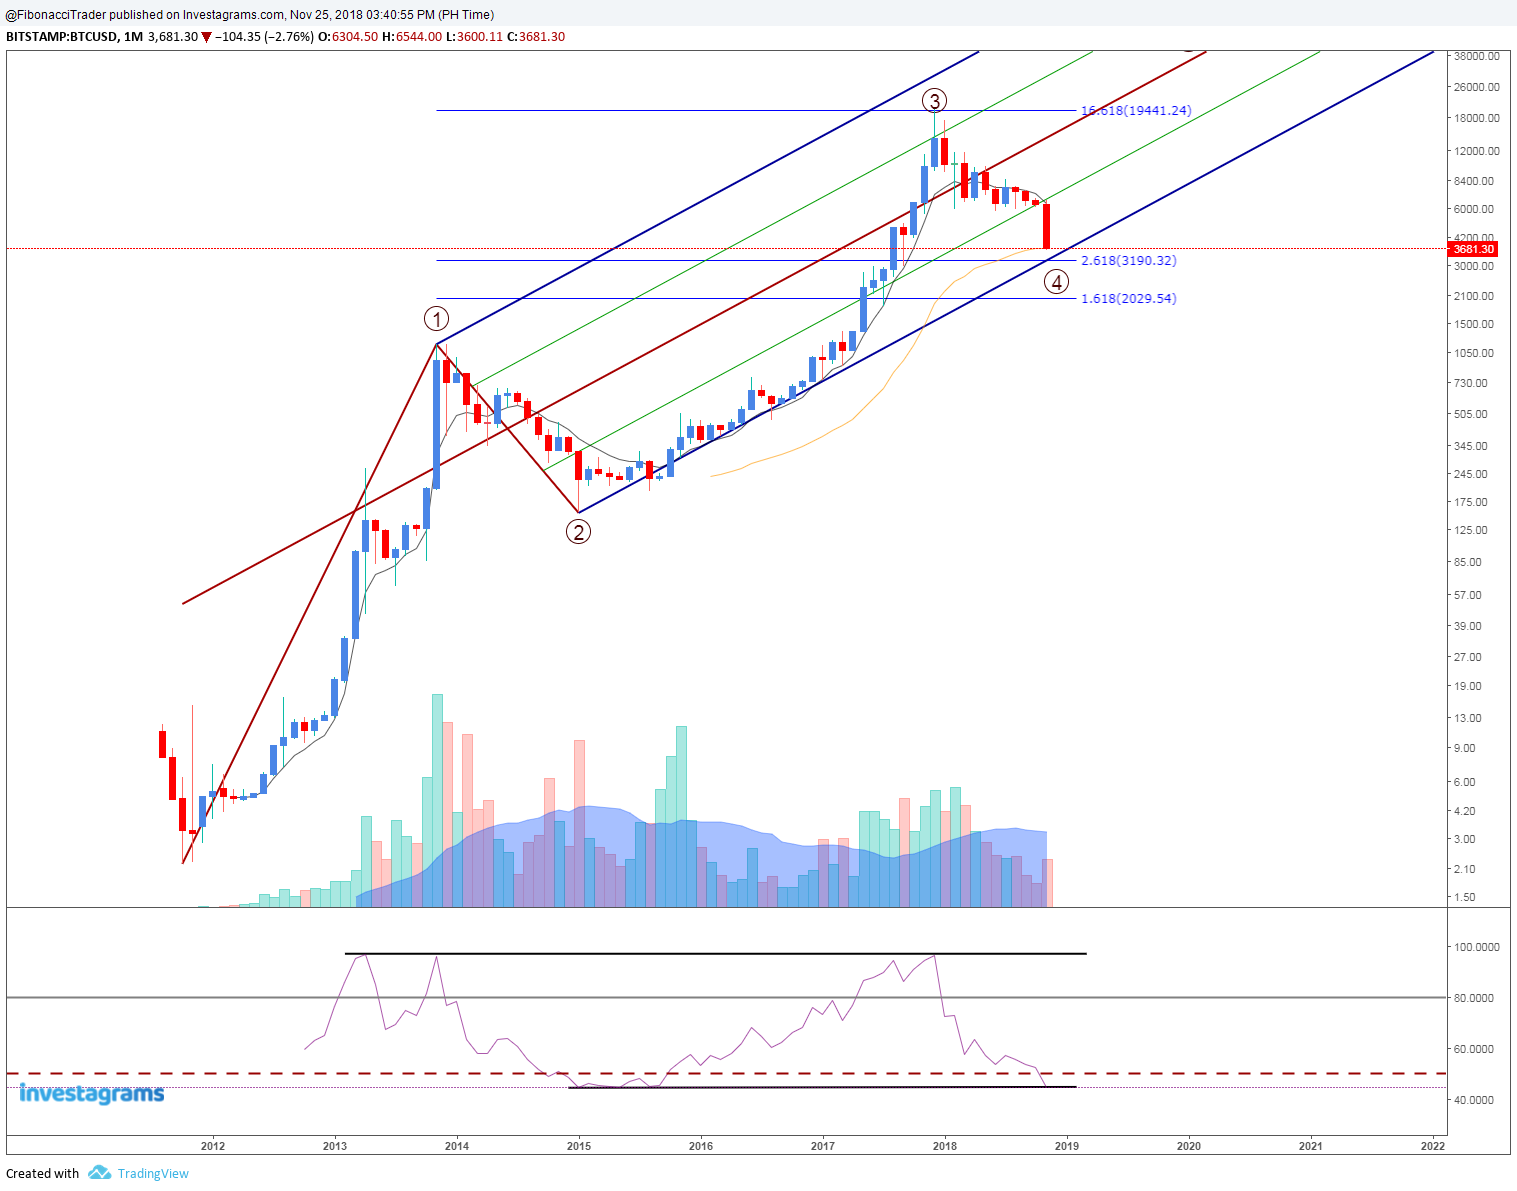
Bitcoin / US Dollar (BTCUSD) Wave 4 is about to end
Looks like Bitcoin / US Dollar (BTCUSD) Wave 4 is nearing it's bottom. Support is seen at 3190.
RSI is also sitting at support. Bitcoin is seems to continue it's uptrend on the second quarter of 2019.
RSI is also sitting at support. Bitcoin is seems to continue it's uptrend on the second quarter of 2019.
Tuesday, November 20, 2018
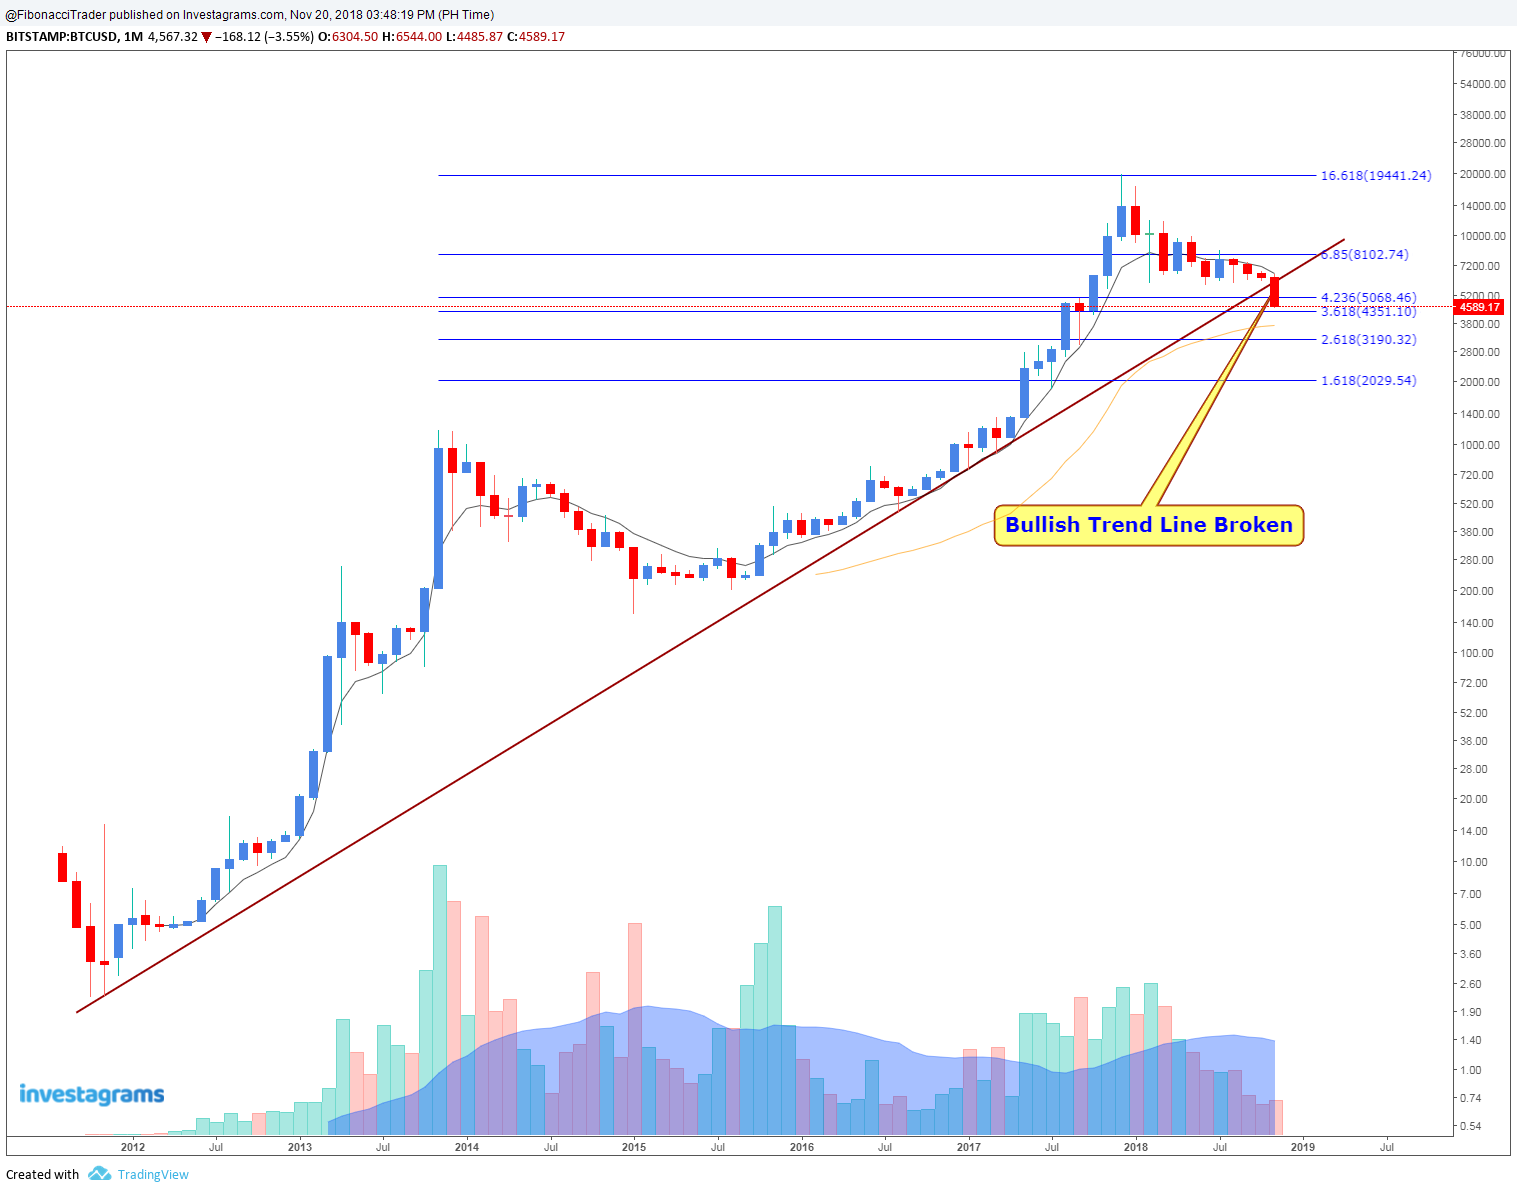
Bitcoin / US Dollar (BTCUSD) Bullish Trend Line Broken
It's seems that Bitcoin / US Dollar (BTCUSD) breaks out downwards from the Bullish Trend Line.
Next support is seen at 4351.
Next support is seen at 4351.
Sunday, May 27, 2018
Bitcoin/Us Dollar (BTCUSD) Potential Bullish Shark - May 27, 2018
Bitcoin/Us Dollar (BTCUSD) maybe making a Potential Bullish Shark Pattern that aims to be completed at 6000-6800 Level.
Resistance is seen at 7686.
Support levels are at 6805, 6430 and 6000.
Trading Plan
Accumulate between 6000- 6800 level.

Resistance is seen at 7686.
Support levels are at 6805, 6430 and 6000.
Trading Plan
Accumulate between 6000- 6800 level.
Sunday, May 6, 2018
BTCUSD Faces a Strong Resistance on 200 Day Moving Average, Good to Buy on Dips
After BTCUSD broke the Downtrend line it's now facing a strong resistance on 200 Day Moving Average, a good to buy on dips.
Resistance is seen at 10,000 while support is at 9164.

Resistance is seen at 10,000 while support is at 9164.
Technical Analysis For Forex, Cryptocurrency and Stocks.
No Hype...No Tsismis... No Drama.... Just Chart!!!!
Join FB Group Here: https://www.facebook.com/groups/155055288511760/
Sunday, April 22, 2018
BTCUSD: Downtrend Line Breakout - April 22, 2018
Looks like BTCUSD broke the four months Downtrend line resistance and might go higher but expect a retest on the Downtrend Line support. Resistance levels are at 9164, 11171 and 12793. Support levels are at 7638 and 6779.


Friday, February 23, 2018
BTCUSD Bullish Alt 161.8% ABCD - Update Two - February 23, 2018
Bitcoin/US Dollar BTCUSD is still inside the Downtrend Channel. Respected the 38.2% fibonacci retracement level and the upper trendline of the channel. Support is seen at 8840.


Wednesday, February 21, 2018
BTCUSD Potential Bullish Alt 161.8% ABCD - Update One - February 21, 2018
BTCUSD respected the Bullish Alt 161.8% ABCD that we posted Here and currently at the 38.2% Fibonacci Retracement Level resistance (Profit Target 1) expect some weaknesses at this level.Next target is at 61.8% Fibonacci Retracement Level (14,415).


Tuesday, February 6, 2018
BTCUSD Potential Bullish Alt 161.8% ABCD - February 6, 2018
Observe 5,900 the Potential Reversal Zone (PRZ) level for possible bounce. Bullish Divergence is also spotted.


Saturday, February 3, 2018
BTCUSD Previous Bullish Gartley Pattern and Falling Wedge
Do you know that BTCUSD made a Bullish Gartley that started January 2013 and completed last January 2015. BTCUSD formed also a Falling Wedge.


BTCUSD Bullish Butterfly - February 3, 2018
BTCUSD completed a Bullish Butterfly Harmonic Pattern and may be forming a Descending Broadening Wedge Pattern..
Buy on current price.
Target 1 - 9,698
Target 2 - 10,979
Target 3 - 13,052
Cut loss below 6,850.
Caveat.

Buy on current price.
Target 1 - 9,698
Target 2 - 10,979
Target 3 - 13,052
Cut loss below 6,850.
Caveat.

Friday, February 2, 2018
BTCUSD - Potential Bullish Bat - Update 1
BTCUSD broke down from the 61.8% Fibonacci Retracement Level support. Expect to go down further to 7100 to 8500 area to complete the Bullish Bat Harmonic Pattern the we identified Here last January 17, 2018.
Buy at 7100 to 8500 area if it holds. Resistance levels are at 9,000, 10,000 and 10,900. Support levels are at 8,500, 8000 and 7,100.

Buy at 7100 to 8500 area if it holds. Resistance levels are at 9,000, 10,000 and 10,900. Support levels are at 8,500, 8000 and 7,100.

Wednesday, January 17, 2018
BTCUSD - Potential Bullish Bat - January 17, 2018

$BTCUSD - Potential Bullish Bat Pattern
If the 61.8% or 10900 Fibonacci Level will not hold
as support this could go to 8500 - 7100 area for the completion of Bullish Bat Pattern.
Cryptocurrency (Bitcoin) Guide for Beginners
1. Open a Cryptocurrency Wallet
Coins.ph https://coins.ph
2. Open an account with a Cryptocurrency Exchange
Binance https://www.binance.com/?ref=21368793
Kucoin https://www.kucoin.com/#/?r=24Nxs
3. Fund your account in cryptocurrency exchange using your cryptocurrency wallet.
4. Enjoy Trading
Accept BTC Donation : 3LKSZ2aoWAvSifEDQBmACWZFN44DCdun28
Subscribe to:
Posts (Atom)