Saturday, December 22, 2018
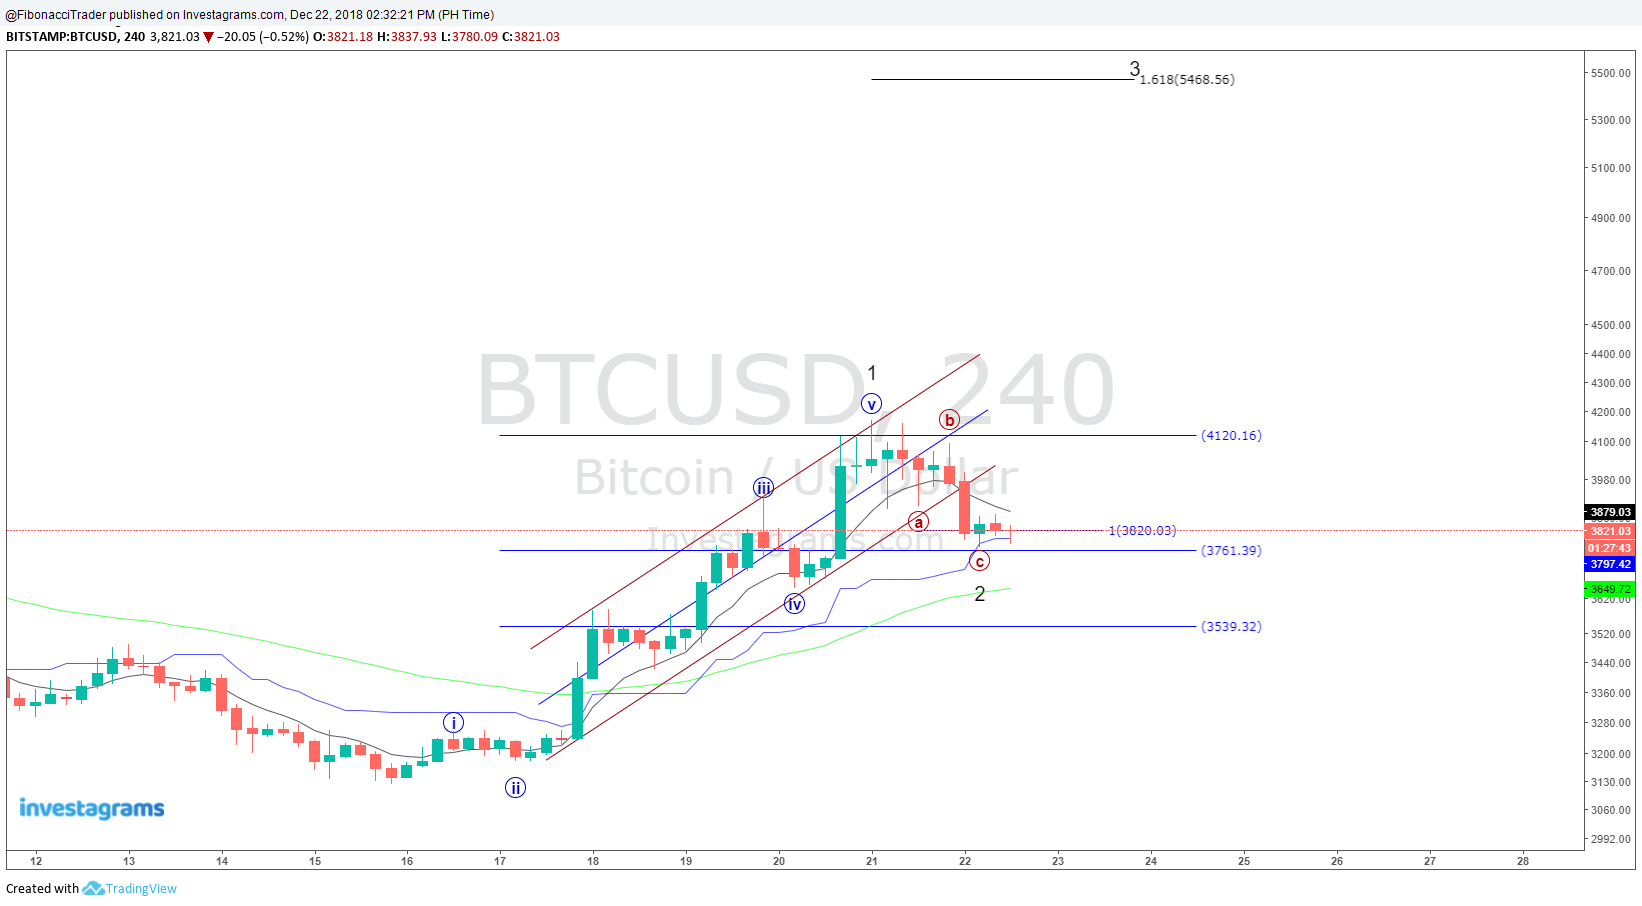
Bitcoin / US Dollar (BTCUSD) WAVE 3?
Looks like Bitcoin / US Dollar (BTCUSD) is going to make the impulse wave 3 with a possible target at 5468.
Friday, December 21, 2018
How to Open Forex Account with Instant Withrawal
1. Open an Forex Account at Exness Here: https://www.exness.com/a/t4cvr4cv
2. Open an Skrill Account to be used as Deposit and Withrawal Here https://account.skrill.com/signup?rid=107968645
3.Open a GCASH Account to be link to skrill for withrawal here : https://gcsh.app/r/zZTfESK
Proof:
Skrill Transactions


Exness Transactions

2. Open an Skrill Account to be used as Deposit and Withrawal Here https://account.skrill.com/signup?rid=107968645
3.Open a GCASH Account to be link to skrill for withrawal here : https://gcsh.app/r/zZTfESK
Proof:
Skrill Transactions


Exness Transactions

Saturday, December 15, 2018
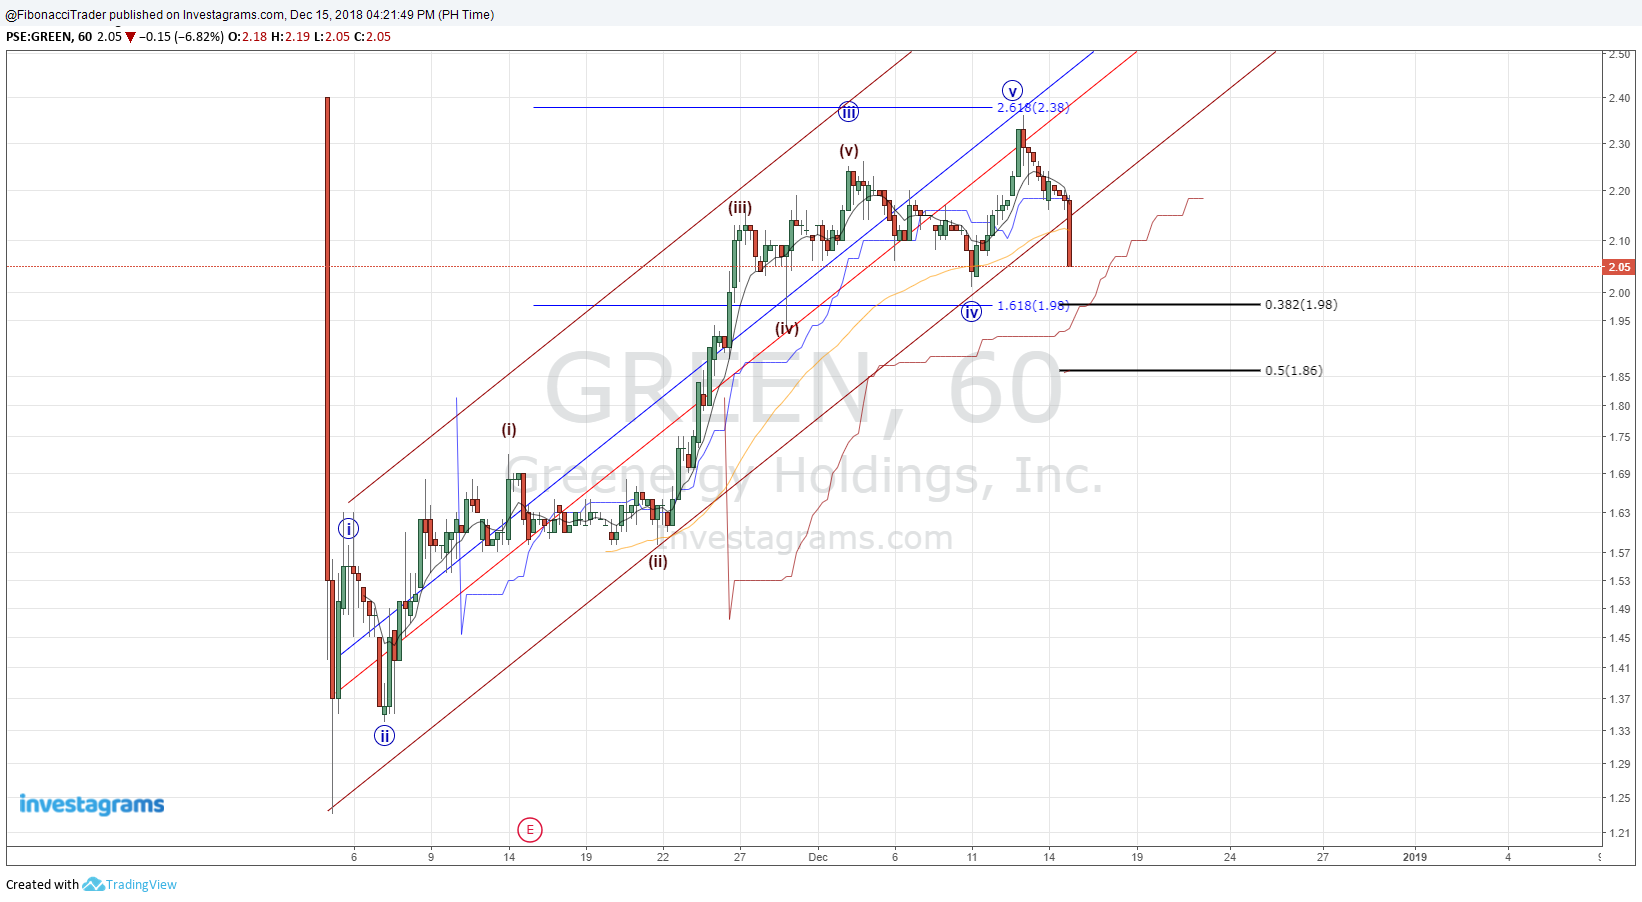
Greenergy Holdings, Inc. (GREEN) Making Corrective ABC
Looks like Greenergy Holdings, Inc. (GREEN) is currently forming the corrective ABC of Elliot Wave. Watch out 2 to 1.80 level for the possible end of Wave C.
Friday, December 14, 2018
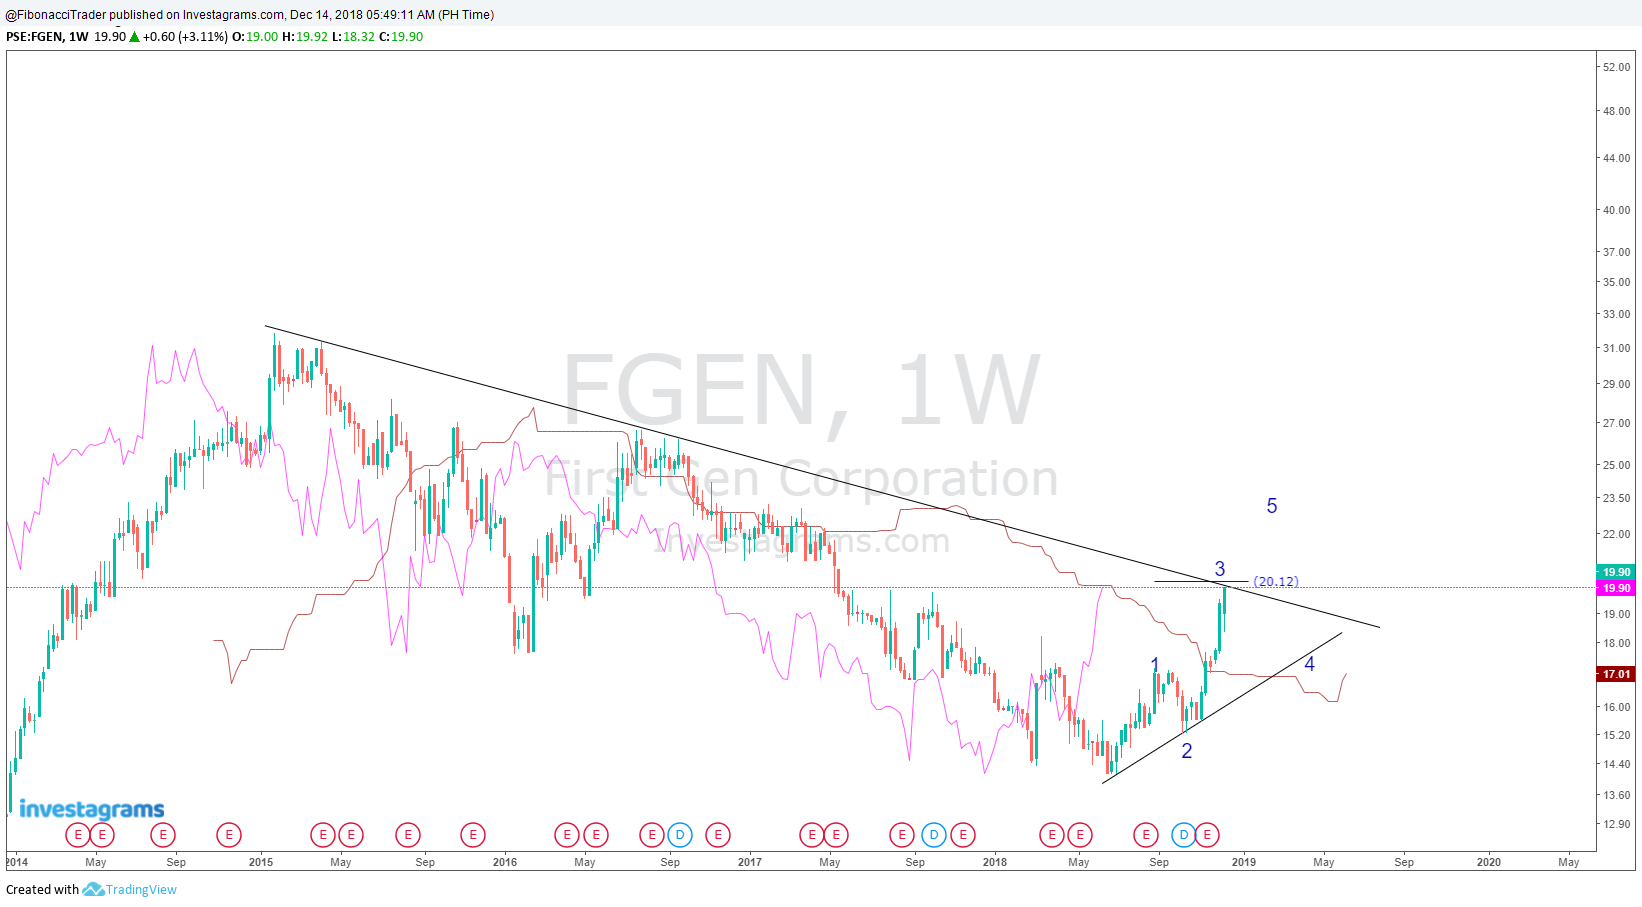
First Gen Corporation (FGEN) Wave 3 is About to End?
It seem that First Gen Corporation (FGEN) Wave 3 is almost over.
Wednesday, December 12, 2018
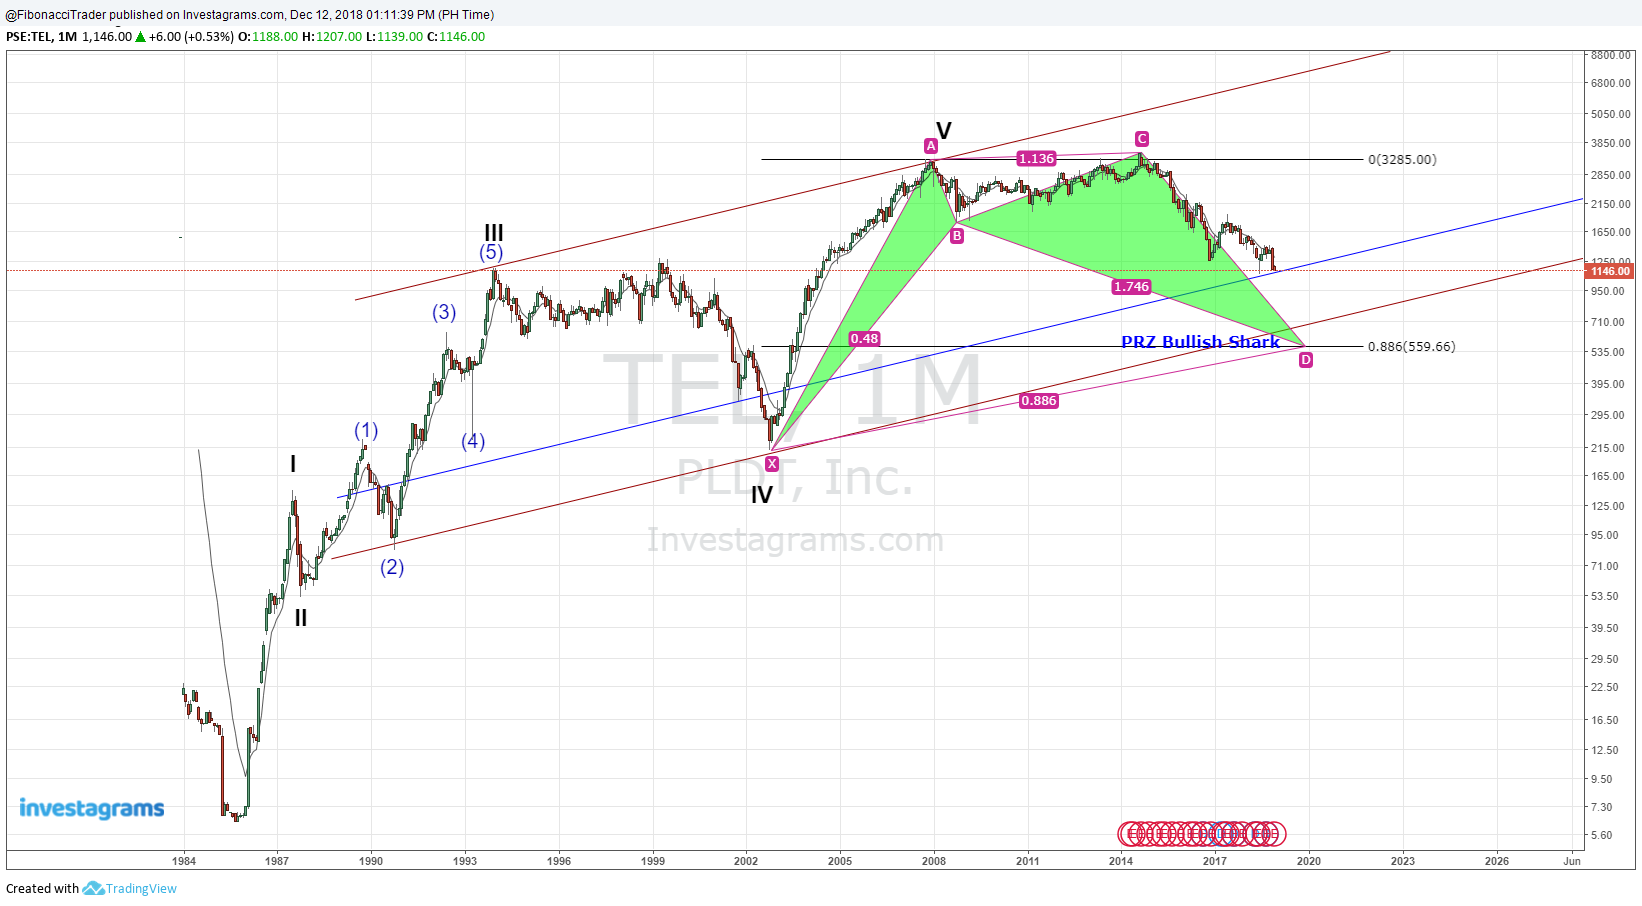
PLDT Inc., (TEL) - ABC Correction : Forecast 560 Level
It's seems that Pldt Inc. (TEL) is currently making the corrective ABC correction of Elliot Wave forecasted to end at 560 level in confluence with the Potential Reversal Zone (PRZ ) of a Bullish Shark Harmonic Pattern.
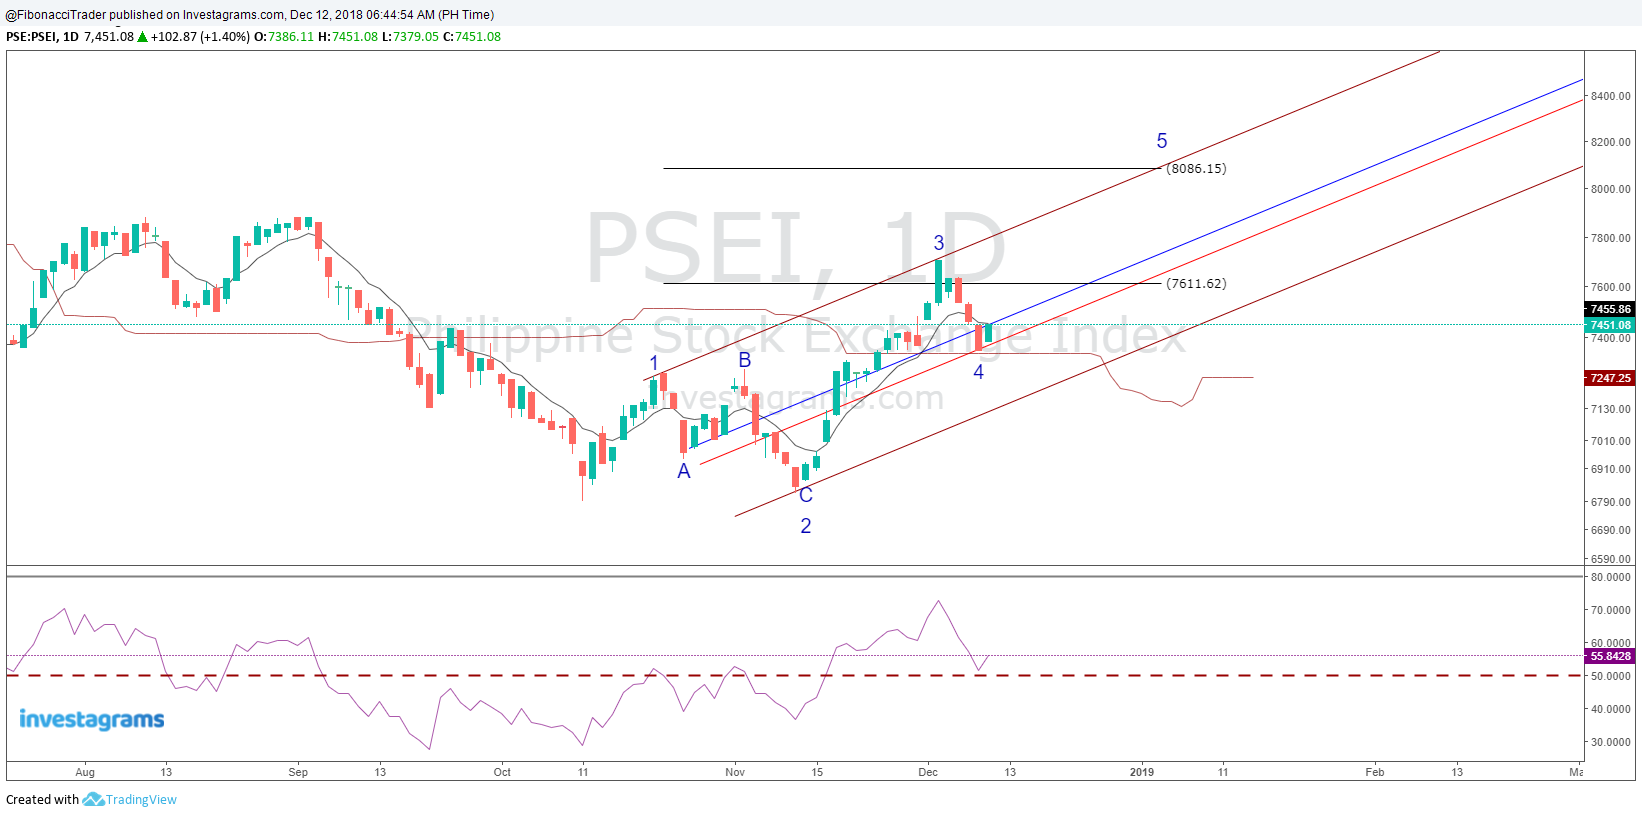
Philippine Stock Exchange Index (PSEi) Wave 5 Target 8,000
Looks like the Philippine Stock Exchange Index (PSEi) is done with Wave 4 and currently making the impulse Wave 5 with a target of 8,000.
Friday, December 7, 2018
The German DAX Supercyle Wave 4
Looks like The German DAX Supercyle Wave 4 will end at 10,200 level.

Wednesday, December 5, 2018
Dow Jones Industrial Average Completes Wave 5 of Elliot Wave
It seems that the Dow Jones Industrial Average completed Wave 5 of Elliot Wave and currently making the corrective ABC.

Tuesday, December 4, 2018
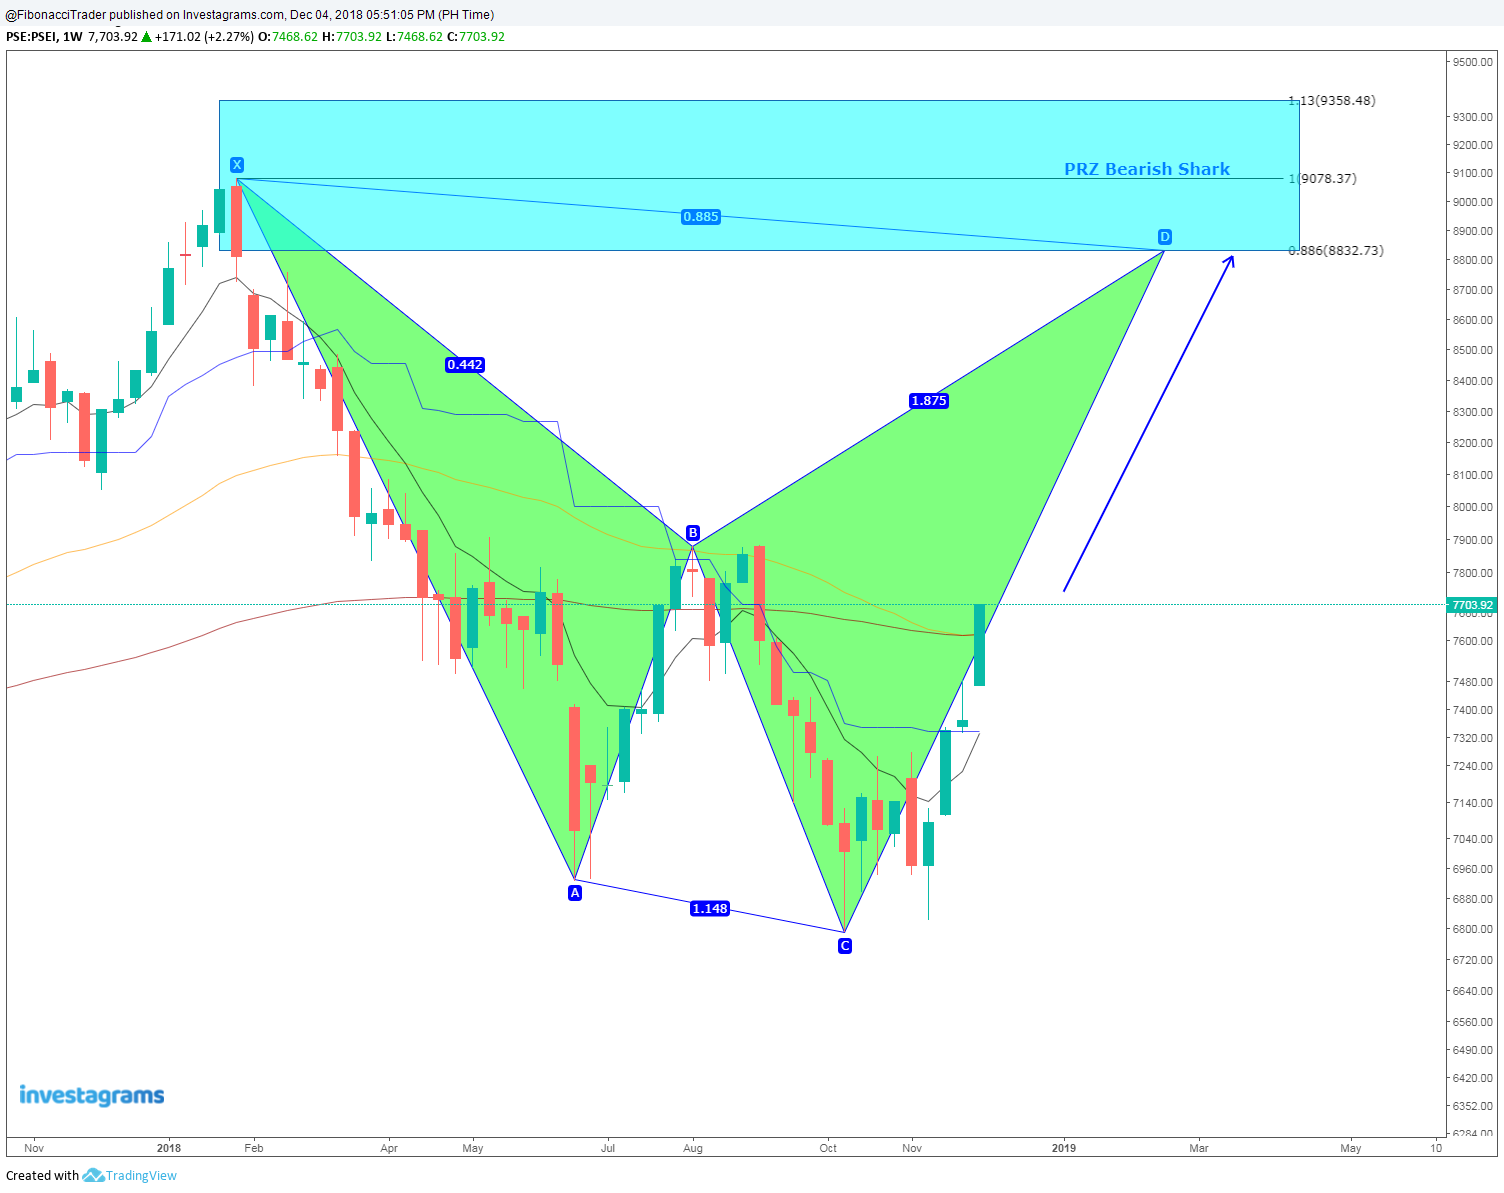
Philippine Stock Exchange Index Forecast : 8,800 to 9350 Level
Looks like the Philippine Stock Exchange Index is making a Potential Bearish Shark that aims to completed between 8,800 to 9,350 level.
Friday, November 30, 2018
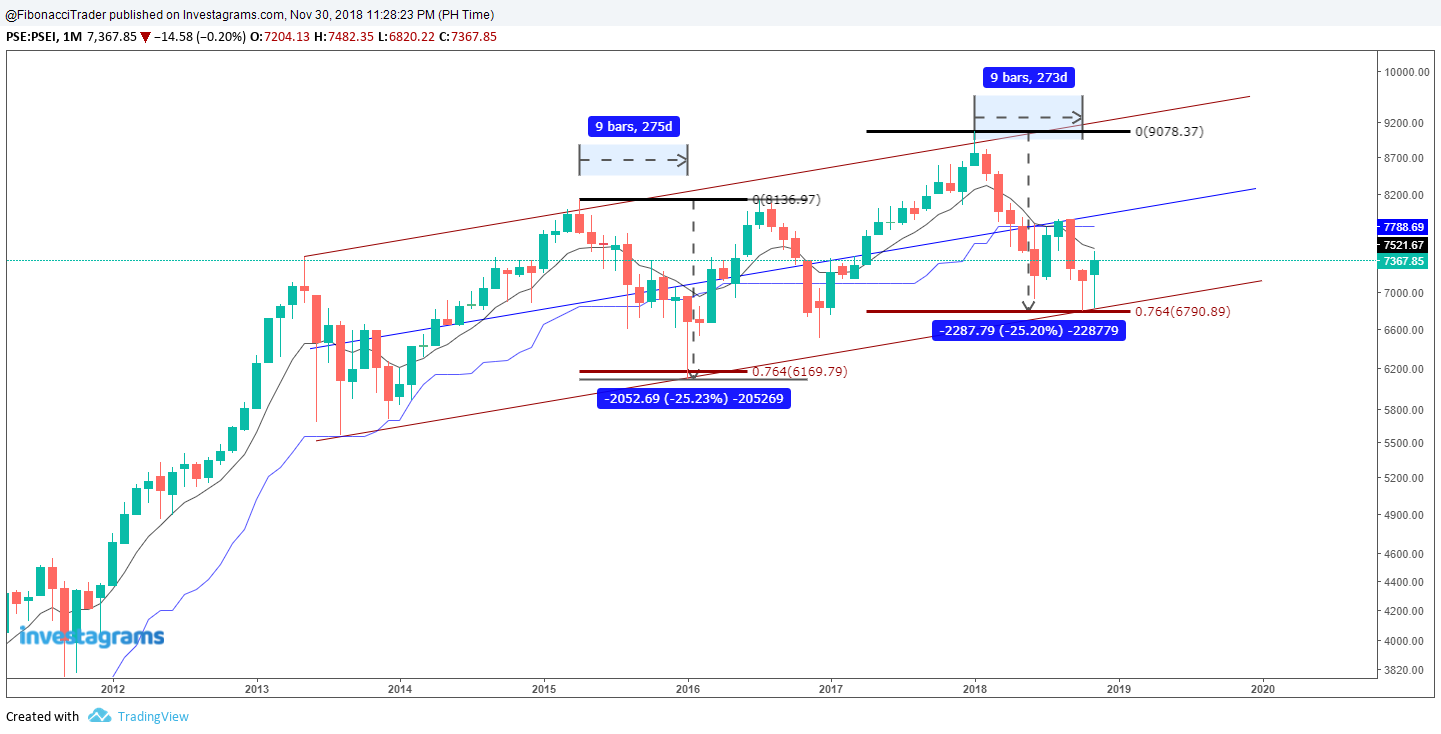
Philippine Stock Exchange Index 2015 and 2018 Market Correction Similarities
Below are the similaries of the Philippine Stock Exchange Index 2015 and 2018 Market Correction
1. The correction lasted for 9 months (275 days for 2015 and 273 days for 2018.
2. 2015 corrected by 25.23% while 2018 is 25.20% .
3. Both 2015 and 2018 retrace by 76.4 % Fibonacci Retracement Level.
1. The correction lasted for 9 months (275 days for 2015 and 273 days for 2018.
2. 2015 corrected by 25.23% while 2018 is 25.20% .
3. Both 2015 and 2018 retrace by 76.4 % Fibonacci Retracement Level.
Sunday, November 25, 2018
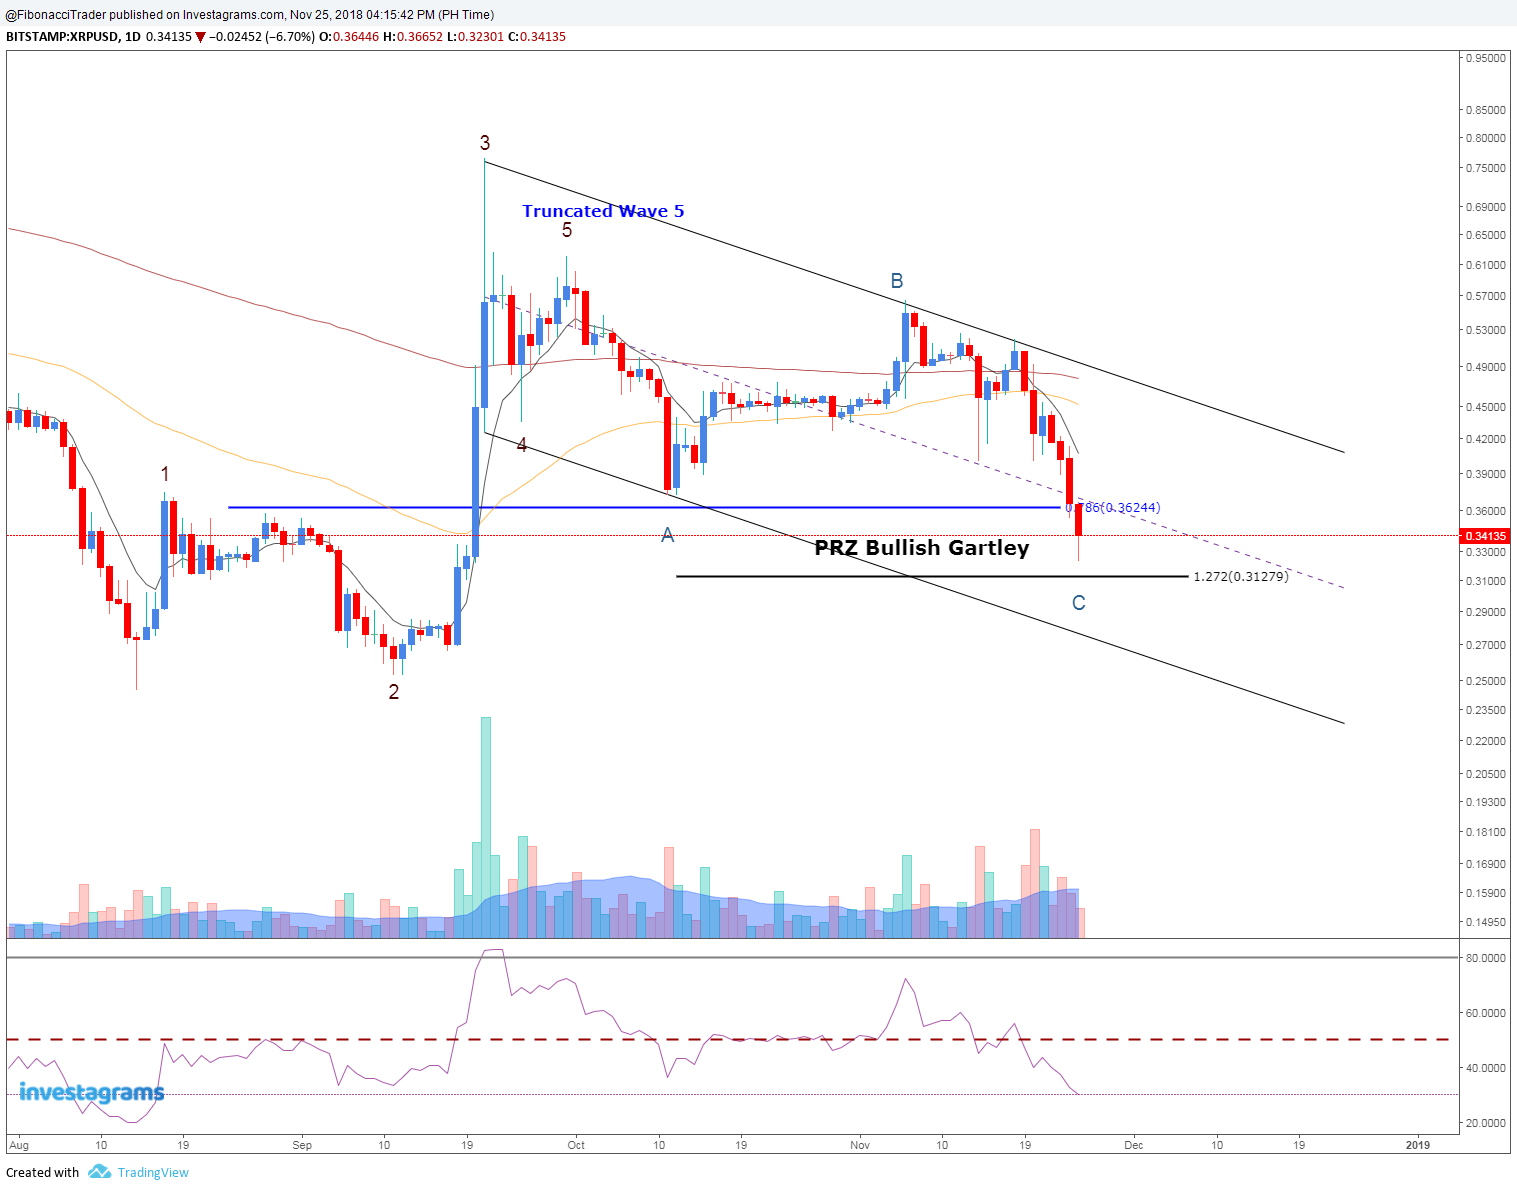
Ripple / US Dollar (XRPUSD) Potential Bullish Gartley
Looks like Ripple / US Dollar (XRPUSD) is currently making a Potential Bullish Gartley.
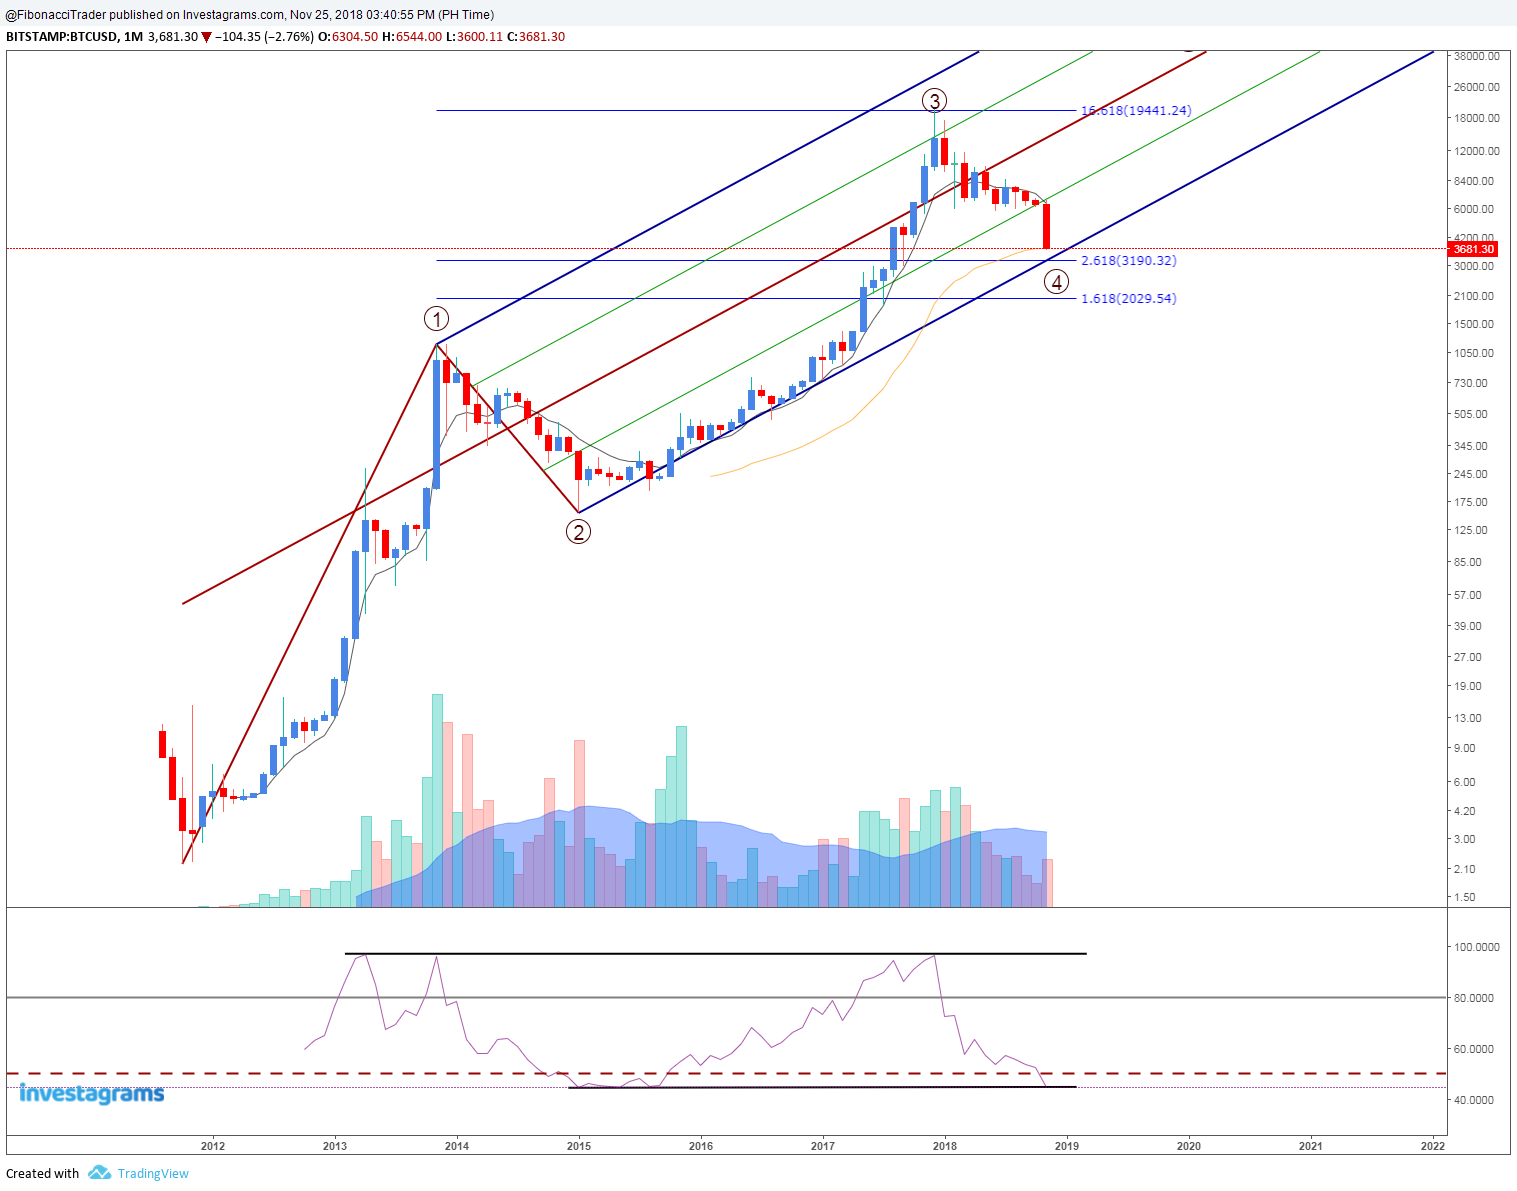
Bitcoin / US Dollar (BTCUSD) Wave 4 is about to end
Looks like Bitcoin / US Dollar (BTCUSD) Wave 4 is nearing it's bottom. Support is seen at 3190.
RSI is also sitting at support. Bitcoin is seems to continue it's uptrend on the second quarter of 2019.
RSI is also sitting at support. Bitcoin is seems to continue it's uptrend on the second quarter of 2019.
Thursday, November 22, 2018
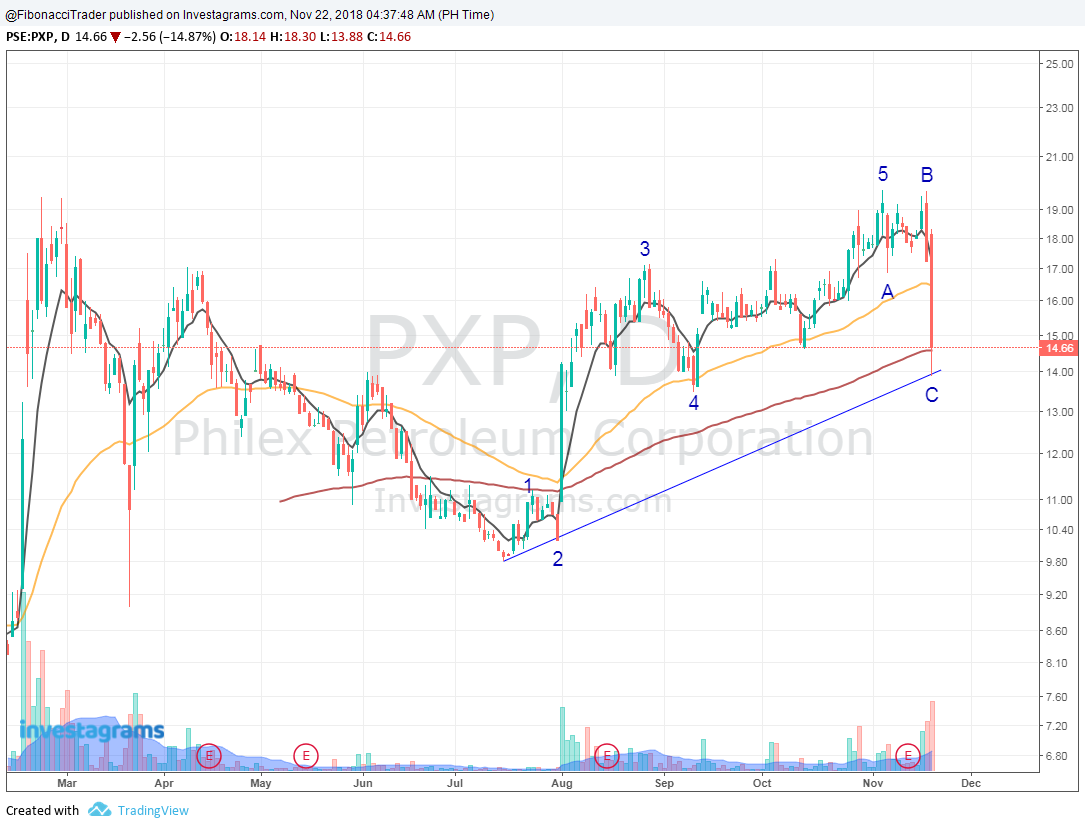
Philex Petroleum Corporation (PXP) Completes ABC Correction
Philex Petroleum Corporation (PXP) completed ABC correction.
Tuesday, November 20, 2018
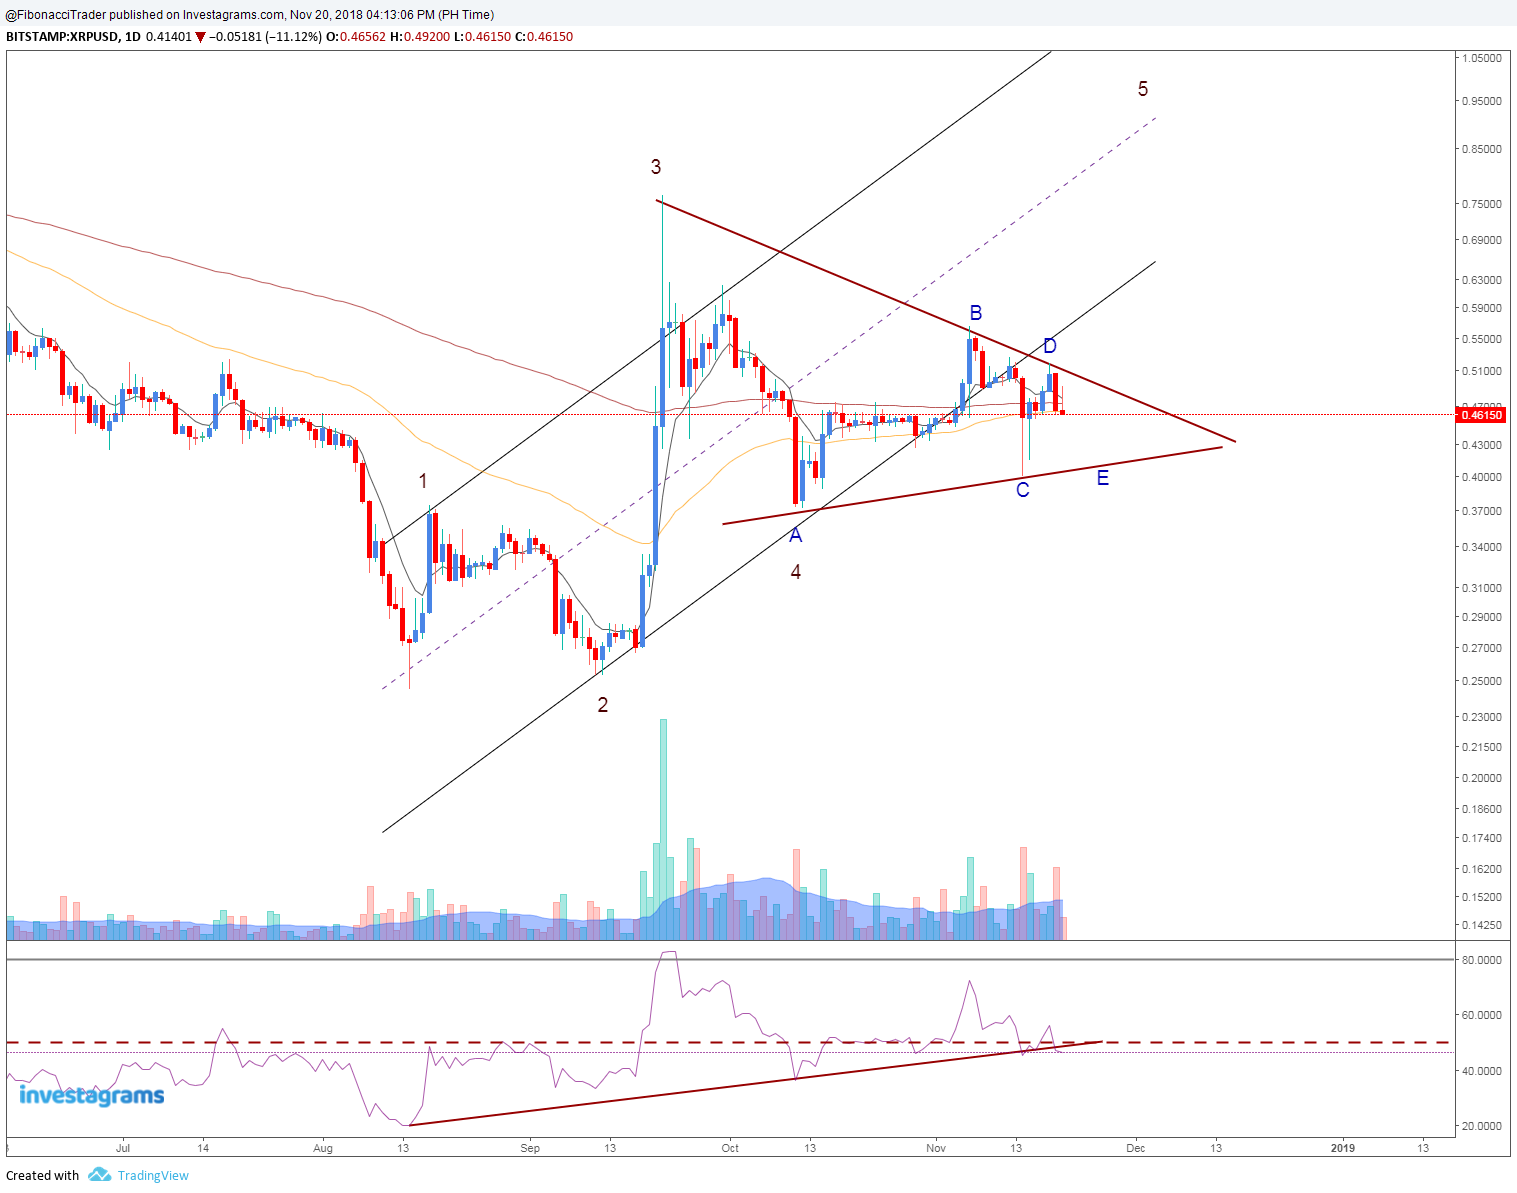
XRPUSD Consolidating on a Symmetrical Triangle
XRPUSD is currently consolidating on a Symmetrical Triangle and my go down to 0.40 level.
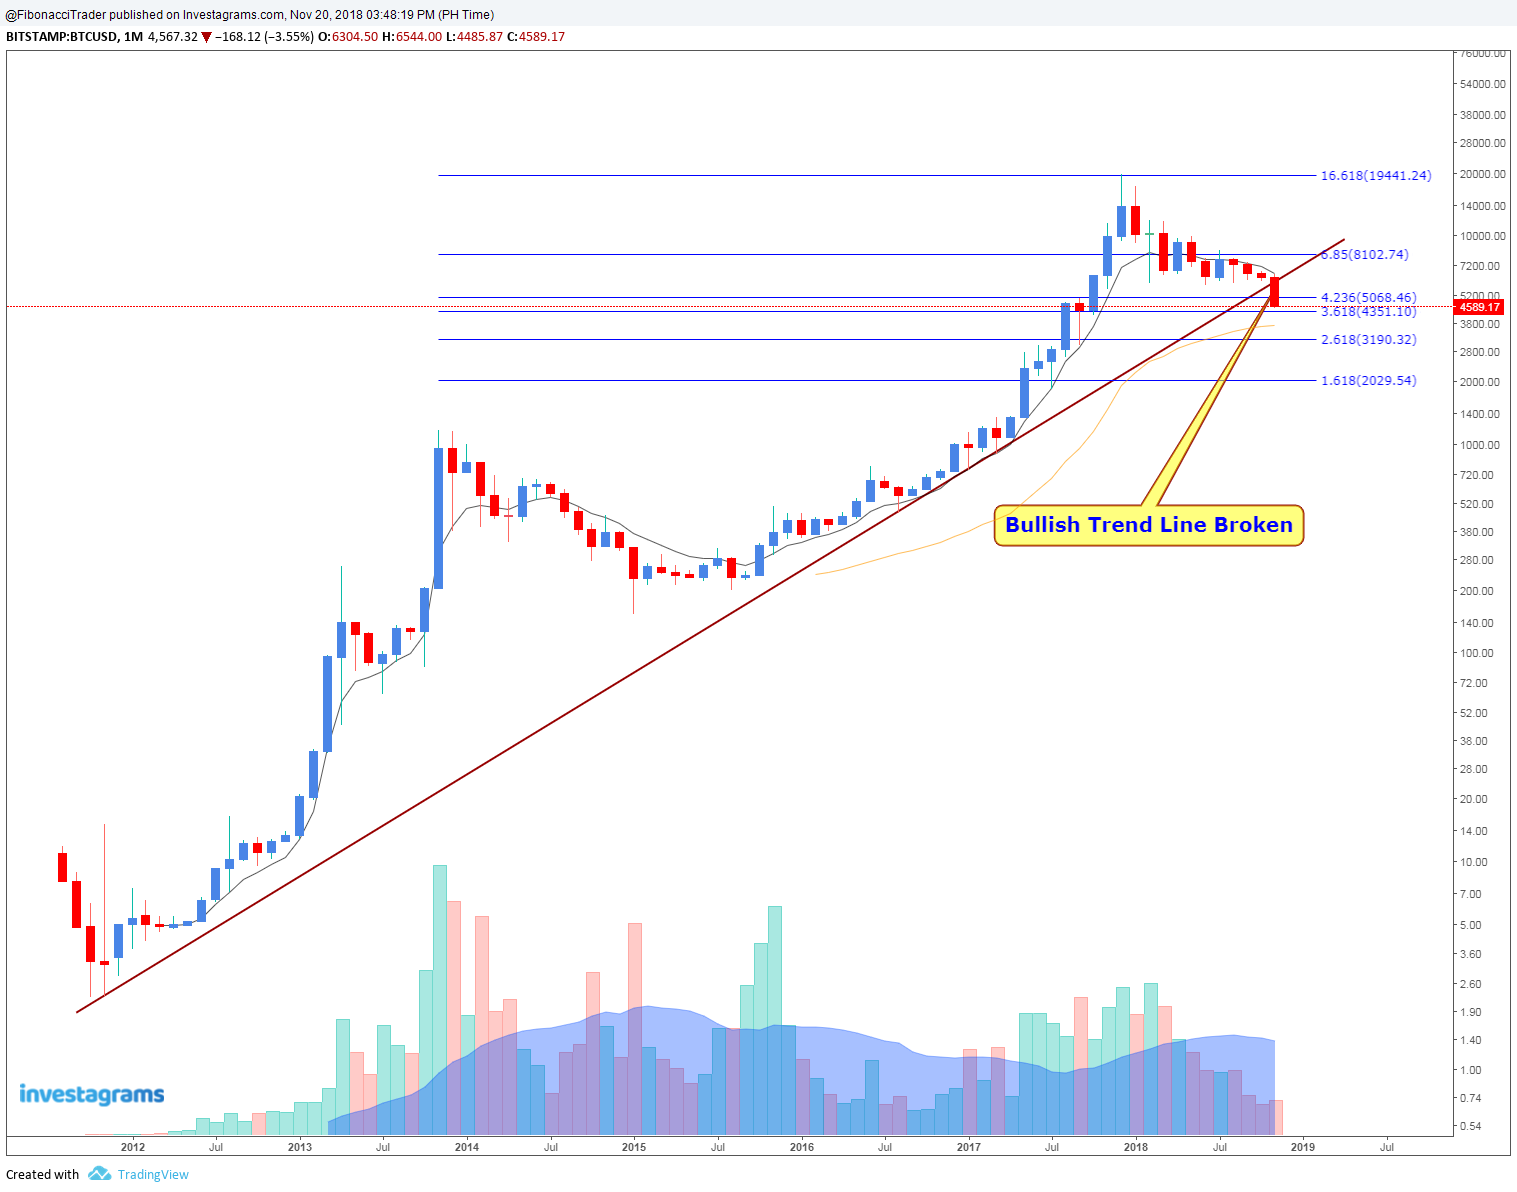
Bitcoin / US Dollar (BTCUSD) Bullish Trend Line Broken
It's seems that Bitcoin / US Dollar (BTCUSD) breaks out downwards from the Bullish Trend Line.
Next support is seen at 4351.
Next support is seen at 4351.
Sunday, November 18, 2018
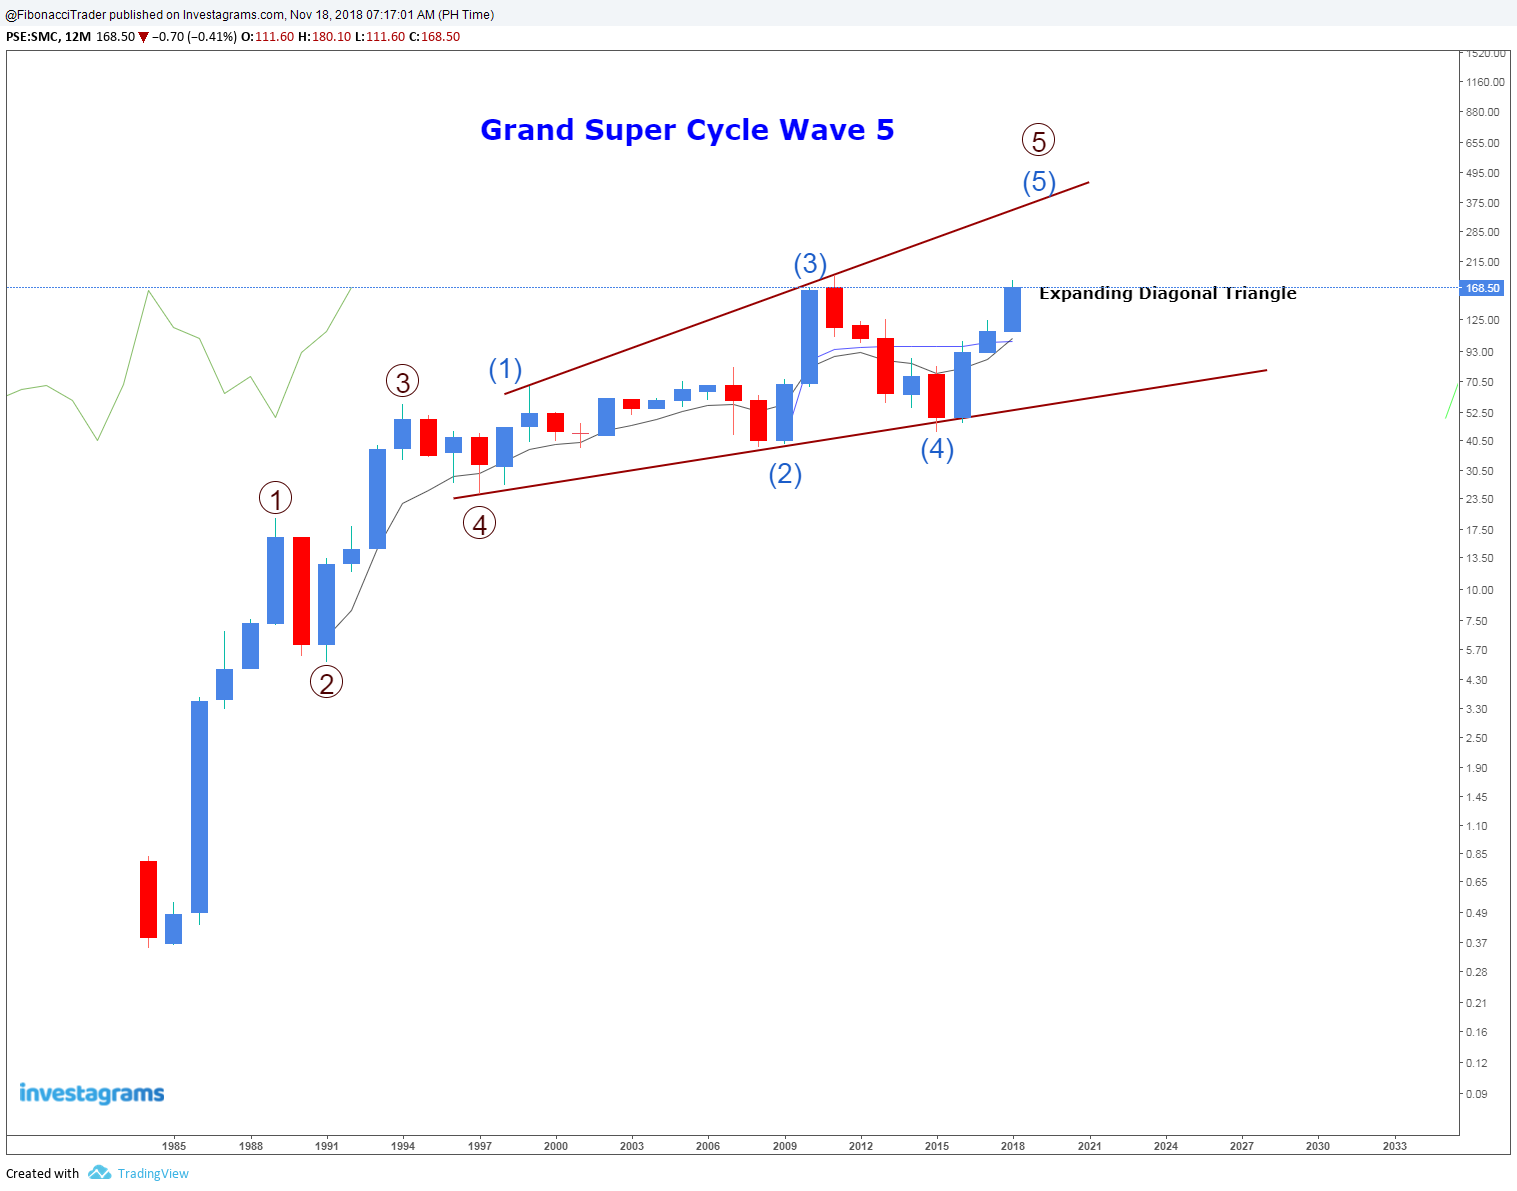
San Miguel Corporation (SMC) Grand Super Cycle Wave 5
It's seems the SMC is on it's way to Grand Super Cycle Wave 5 and currently making a expanding Diagonal Triangle.
Wednesday, November 14, 2018
Philippine Stock Exchange Index (PSEi) Wave 4 of Grand Super Cycle
>Philippine Stock Exchange Index (PSEi) is currently on wave 4 of Grand Super cycle.
>Wave 4 maybe between 7,168 and 4,076.
>Wave 5 of the Grand Super cycle is between 10,000 to 14,000.
>Wave 4 maybe between 7,168 and 4,076.
>Wave 5 of the Grand Super cycle is between 10,000 to 14,000.
Sunday, November 4, 2018
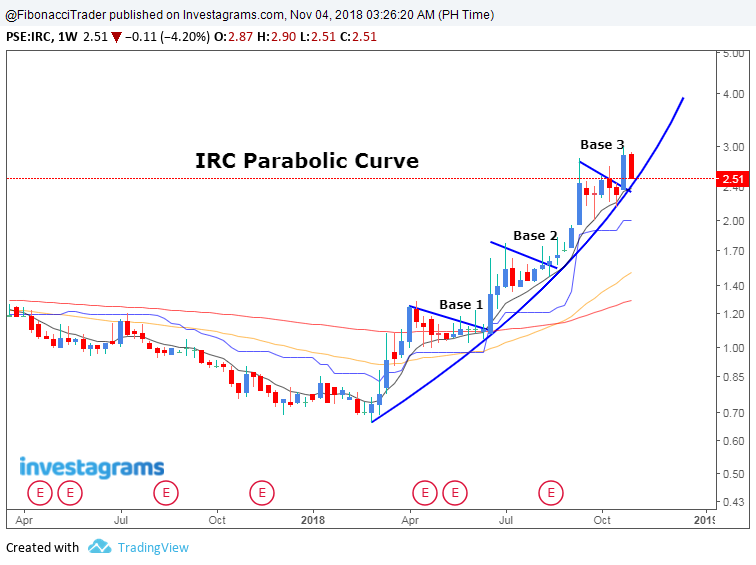
The Parabolic Curve Pattern IRC Properties, Inc.

Wednesday, October 31, 2018
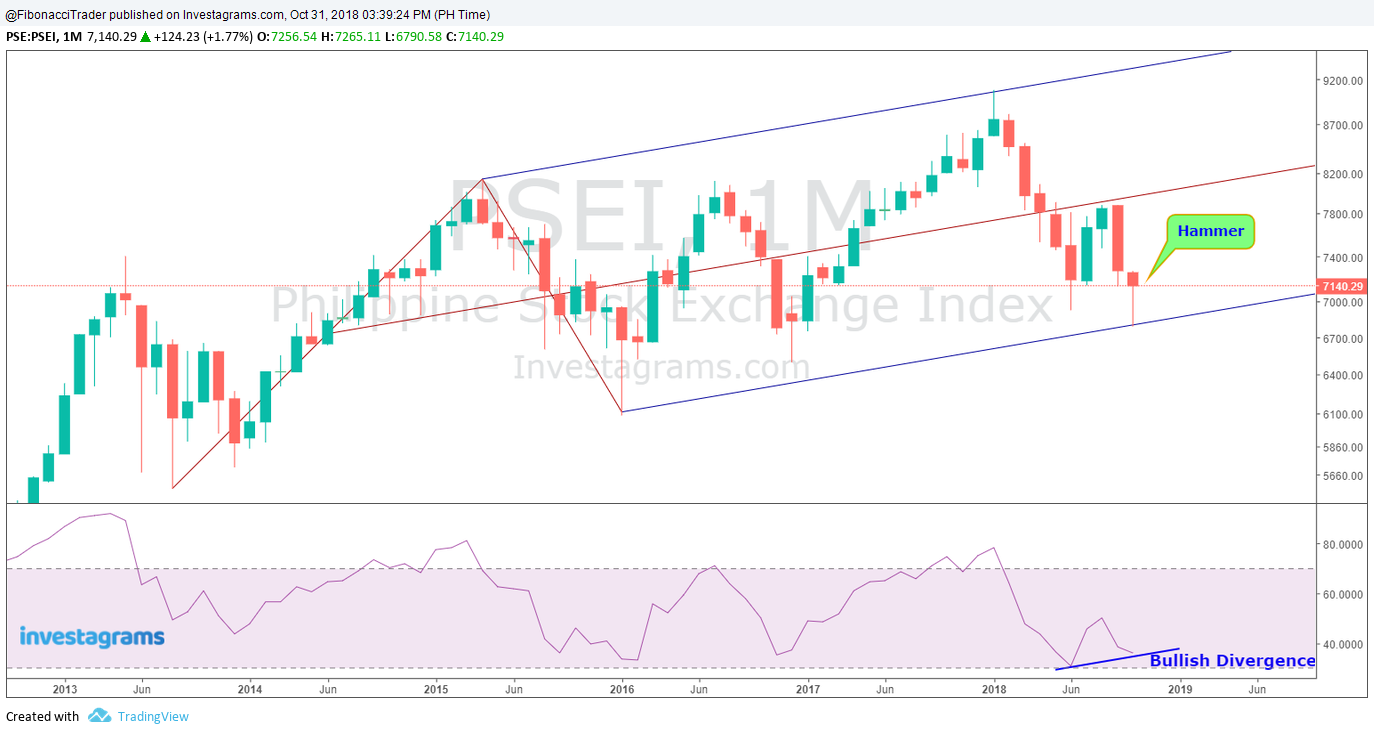
Philippine Stock Exchange Index (PSEi) It's Hammer Time
The Philippine Stock Exchange Index (PSEi) Monthly Chart closed with Bullish Hammer candle stick pattern.
Vulcan Industrial and Mining Corporation - Voluntary Trading Suspension

Seating Above the 161.8% Golden Ratio
REQUEST FOR TRADING SUSPENSIONVulcan Industrial & Mining Corporation (Company) received certain communications after trading hours yesterday, for which the Board of Directors will hold a special meeting today, October 31, 2018, where proposals that may materially affect the future business direction of the Company are expected to be taken up.
Stock Symbol(s) of Affected Securities
VUL
Trading Suspension Details Execution Date Oct 31, 2018
Execution Time 9:00 AM
Lifting Date Nov 5, 2018
Lifting Time 9:00 AM
Reason(s) for the request
The proposals that are expected to be taken up during the Board meeting may affect market activity with respect to listed VUL securities and lead to speculation prior to board action on the proposals. The trading suspension will enable the Company to provide its shareholders and the investing public with equal opportunity to (a) examine the details of the results of the Board meeting, and (b) fully appraise their investment position in VUL shares in light of such results.
http://edge.pse.com.ph/openDiscViewer.d ... A3Ksw.dpbs
Tuesday, October 30, 2018
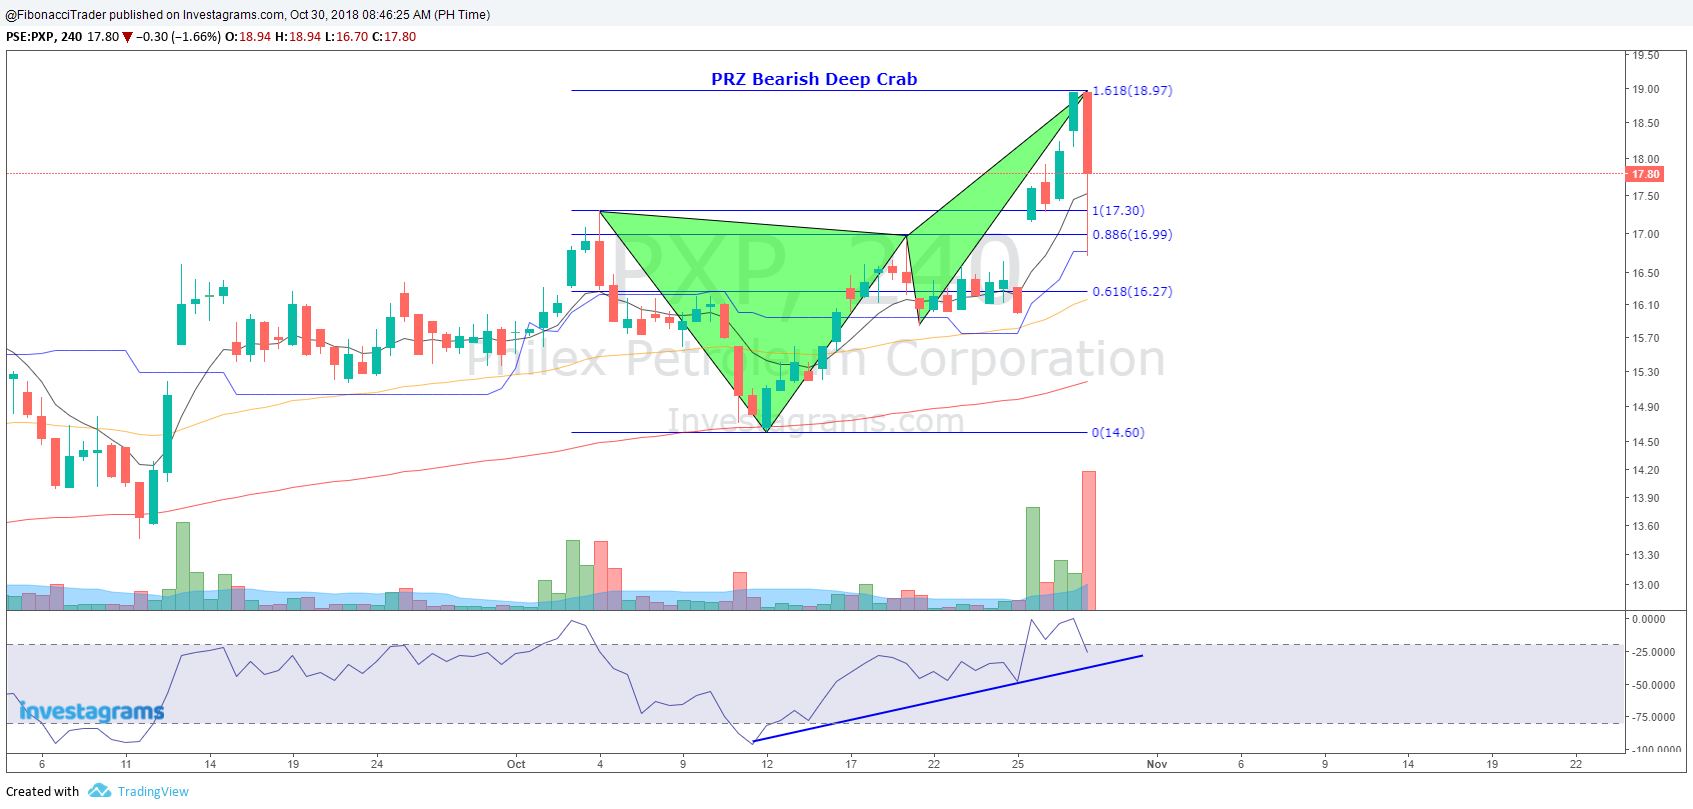
Philex Petroleum Corporation (PXP) Bearish Deep Crab
It seem's that Philex Petroleum Corporation (PXP) completed a Bearish Deep Crab harmonic Pattern.
USD/PHP Philippine Peso Forecast : 52
The chart is telling us that we will have a stronger peso this coming days and it is foretasted to go down to 52 level to complete the Potential Bullish Cypher Harmonic Pattern.

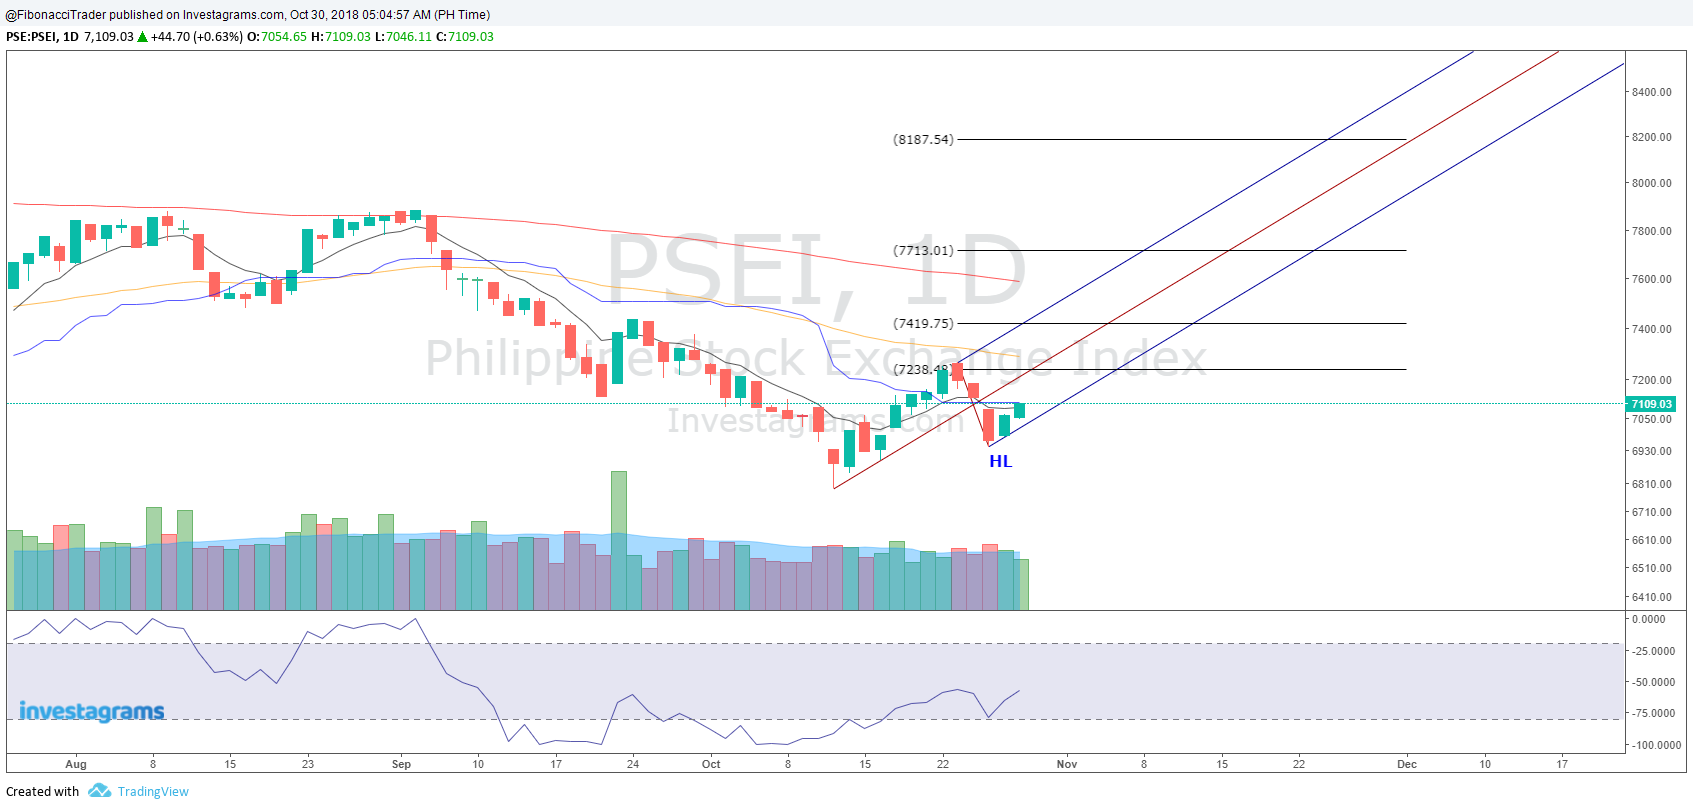
Philippine Stock Exchange Index (PSEi) Makes Higher Low
Looks like Philippine Stock Exchange Index (PSEi) made Higher Low which is positive. If it breaks 7238 then the next resistance is at 7419. Support is seen at 6941.
Sunday, October 28, 2018
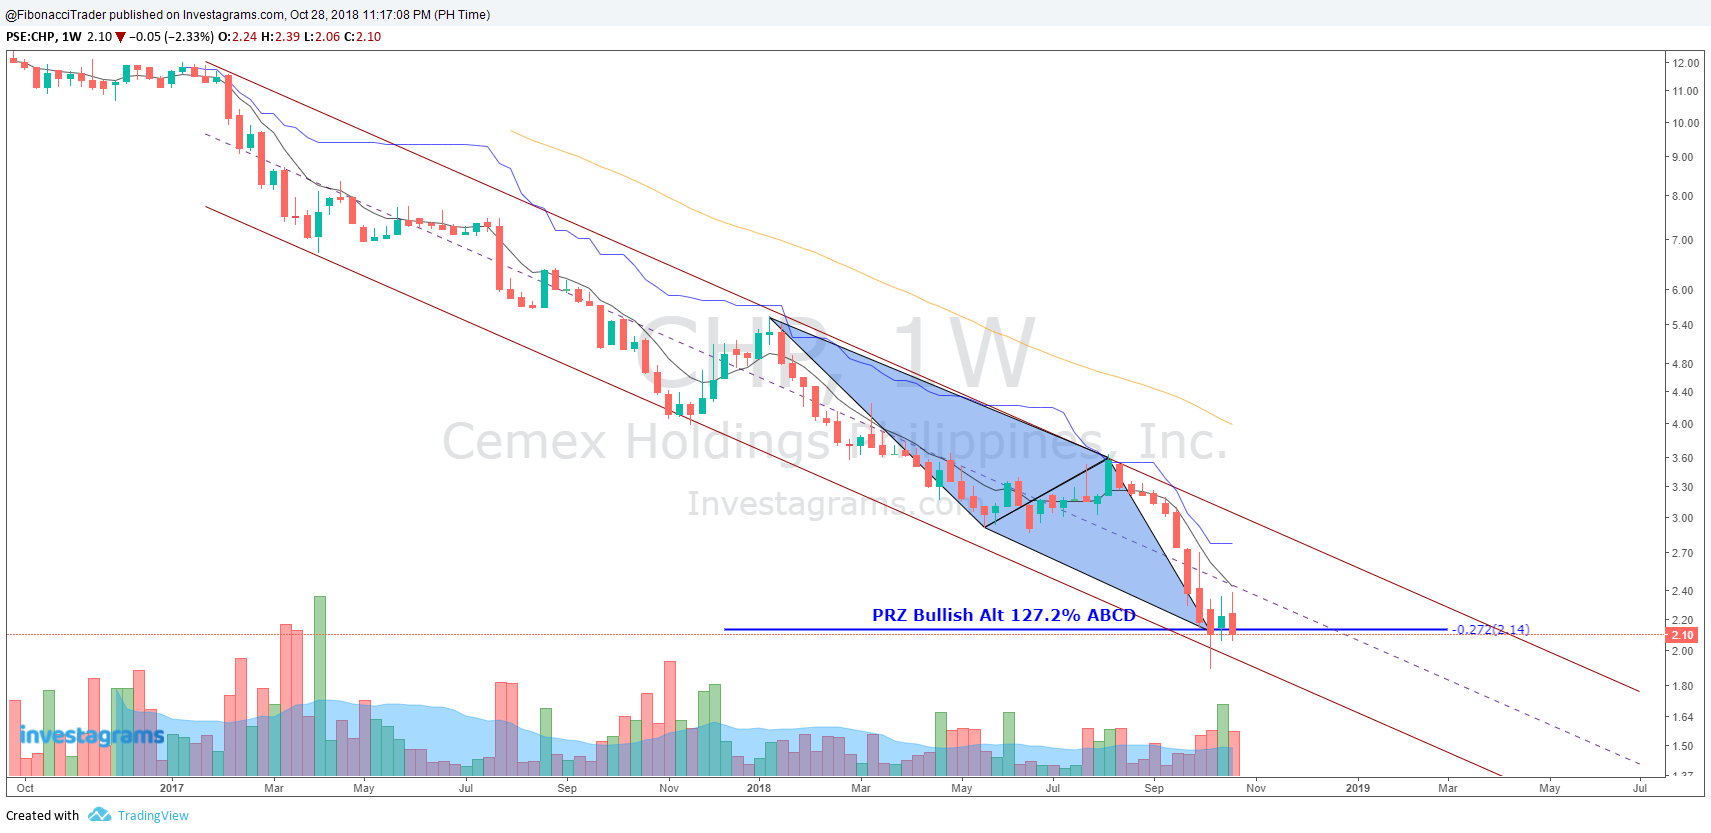
Cemex Holdings Philippines, Inc. (CHP ) Bullish Alt 127.2% ABCD
It seems that Cemex Holdings Philippines, Inc. (CHP ) completed a Bullish Alt 127.2% ABCD.
Tuesday, October 23, 2018
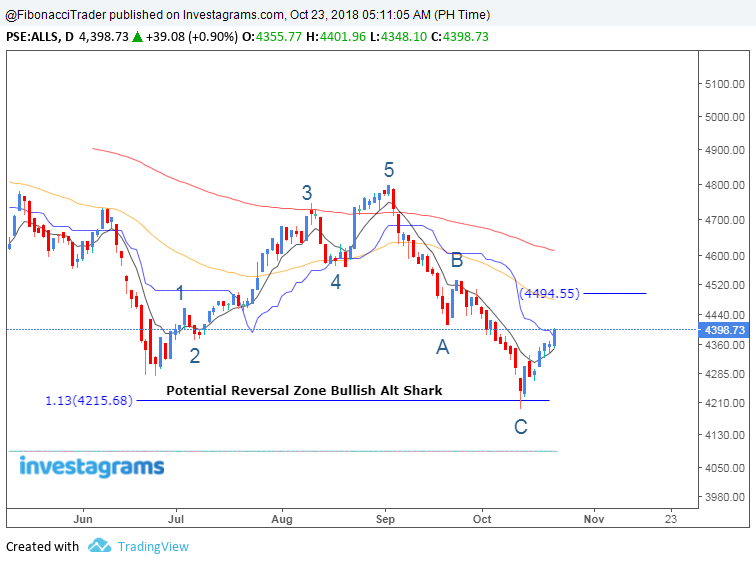
All Shares Index ABC Correction Finish
It seems that the All Shares Index completed the ABC correction of Elliot Wave in confluence with the completion of a Bullish Alt Shark Harmonic Pattern. All Shares Index needs to break 4495 to negate the downtrend.
Refer to my previous analysis : http://www.fibonaccitrader618.com/2018/10/all-shares-index-potential-bullish-shark.html
Refer to my previous analysis : http://www.fibonaccitrader618.com/2018/10/all-shares-index-potential-bullish-shark.html
Sunday, October 21, 2018
Gold Breaks From Down Trend Line
Looks like gold found major it's support at 1160 and broke from the downtrend line after 2 months of consolidation. It might retest first the 1200 area before it will go higher. Resistance is seen at 1238 and 1262 while support at 1200.

Wednesday, October 17, 2018
iShares MSCI Philippines (EPHE) Bullish Alt Shark
iShares MSCI Philippines (EPHE) retested the Potential Reversal Zone (PRZ) of A Bullish Alt Shark Pattern. There is also a Bullish Divergence between the price and indicator.

Thursday, October 11, 2018
Dow Jones Industrial Average (DJI) - Double Top
Dow Jones Industrial Average (DJI) completed a Double Top pattern. Support is seen at 25573 then at 25148.

Wednesday, October 10, 2018
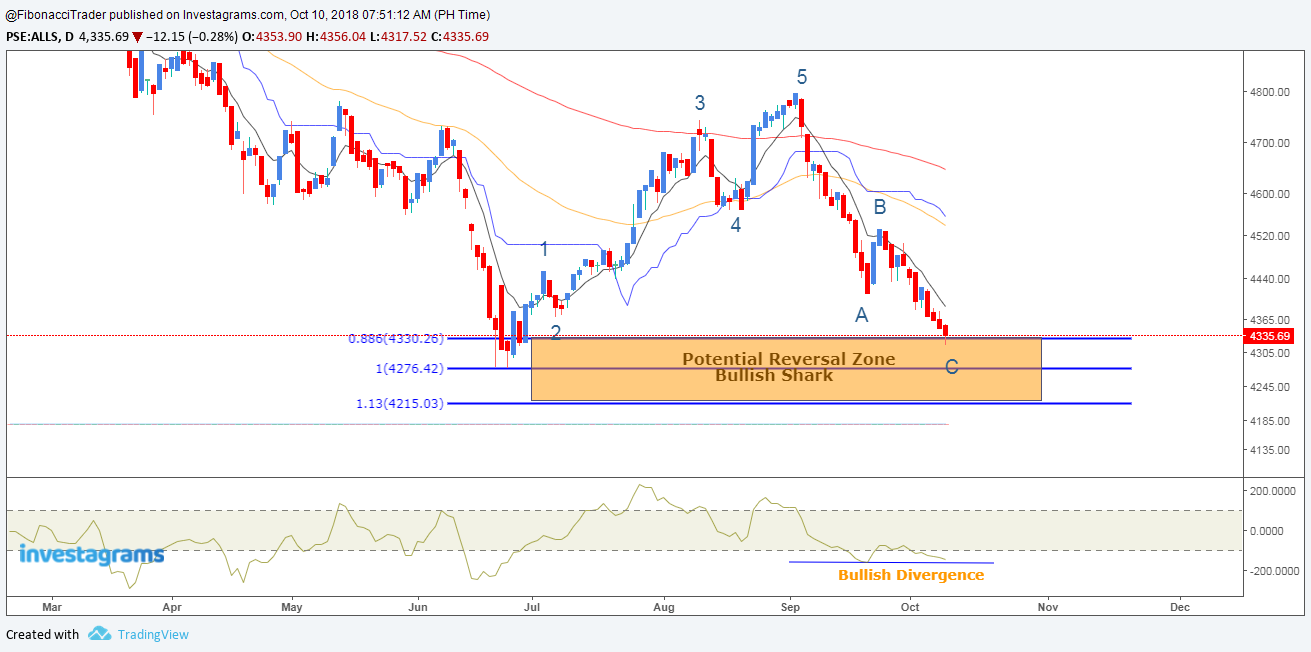
All Shares Index Potential Bullish Shark
It seems that All Shares Index is currently making a Potential Bullish Shark that aims to be completed between 4215 to 4330 level. This is also in confluence with the final wave C of the Corrective ABC of Elliot wave.
Saturday, October 6, 2018
Inflation zoom to new 9-year high of 6.7% in September
The Philippines' annual inflation rate rose to 6.7 percent in September of 2018 from 6.4 percent in the previous month, and compared to market expectations of 6.8 percent. It is the highest reading since February 2009. due to a surge in prices of food and a faster rise cost of transport. On a monthly basis, consumer prices went up 0.8 percent, after a 0.9 percent rise in August. Inflation Rate in Philippines averaged 8.40 percent from 1958 until 2018, reaching an all time high of 62.80 percent in September of 1984 and a record low of -2.10 percent in January of 1959. (source: https://tradingeconomics.com)


Sunday, September 30, 2018
Crude Oil (WTI) Forecast 82 to 108 Per Barrel
Crude Oil (WTI) is forecasted to go to 82 to 108 Per Barrel. If Wave 3 is extended it might go to 108 per barrel.

Friday, September 28, 2018
The Parabolic Curve Pattern Vulcan Industrial and Mining Corporation (VUL?) Update 1
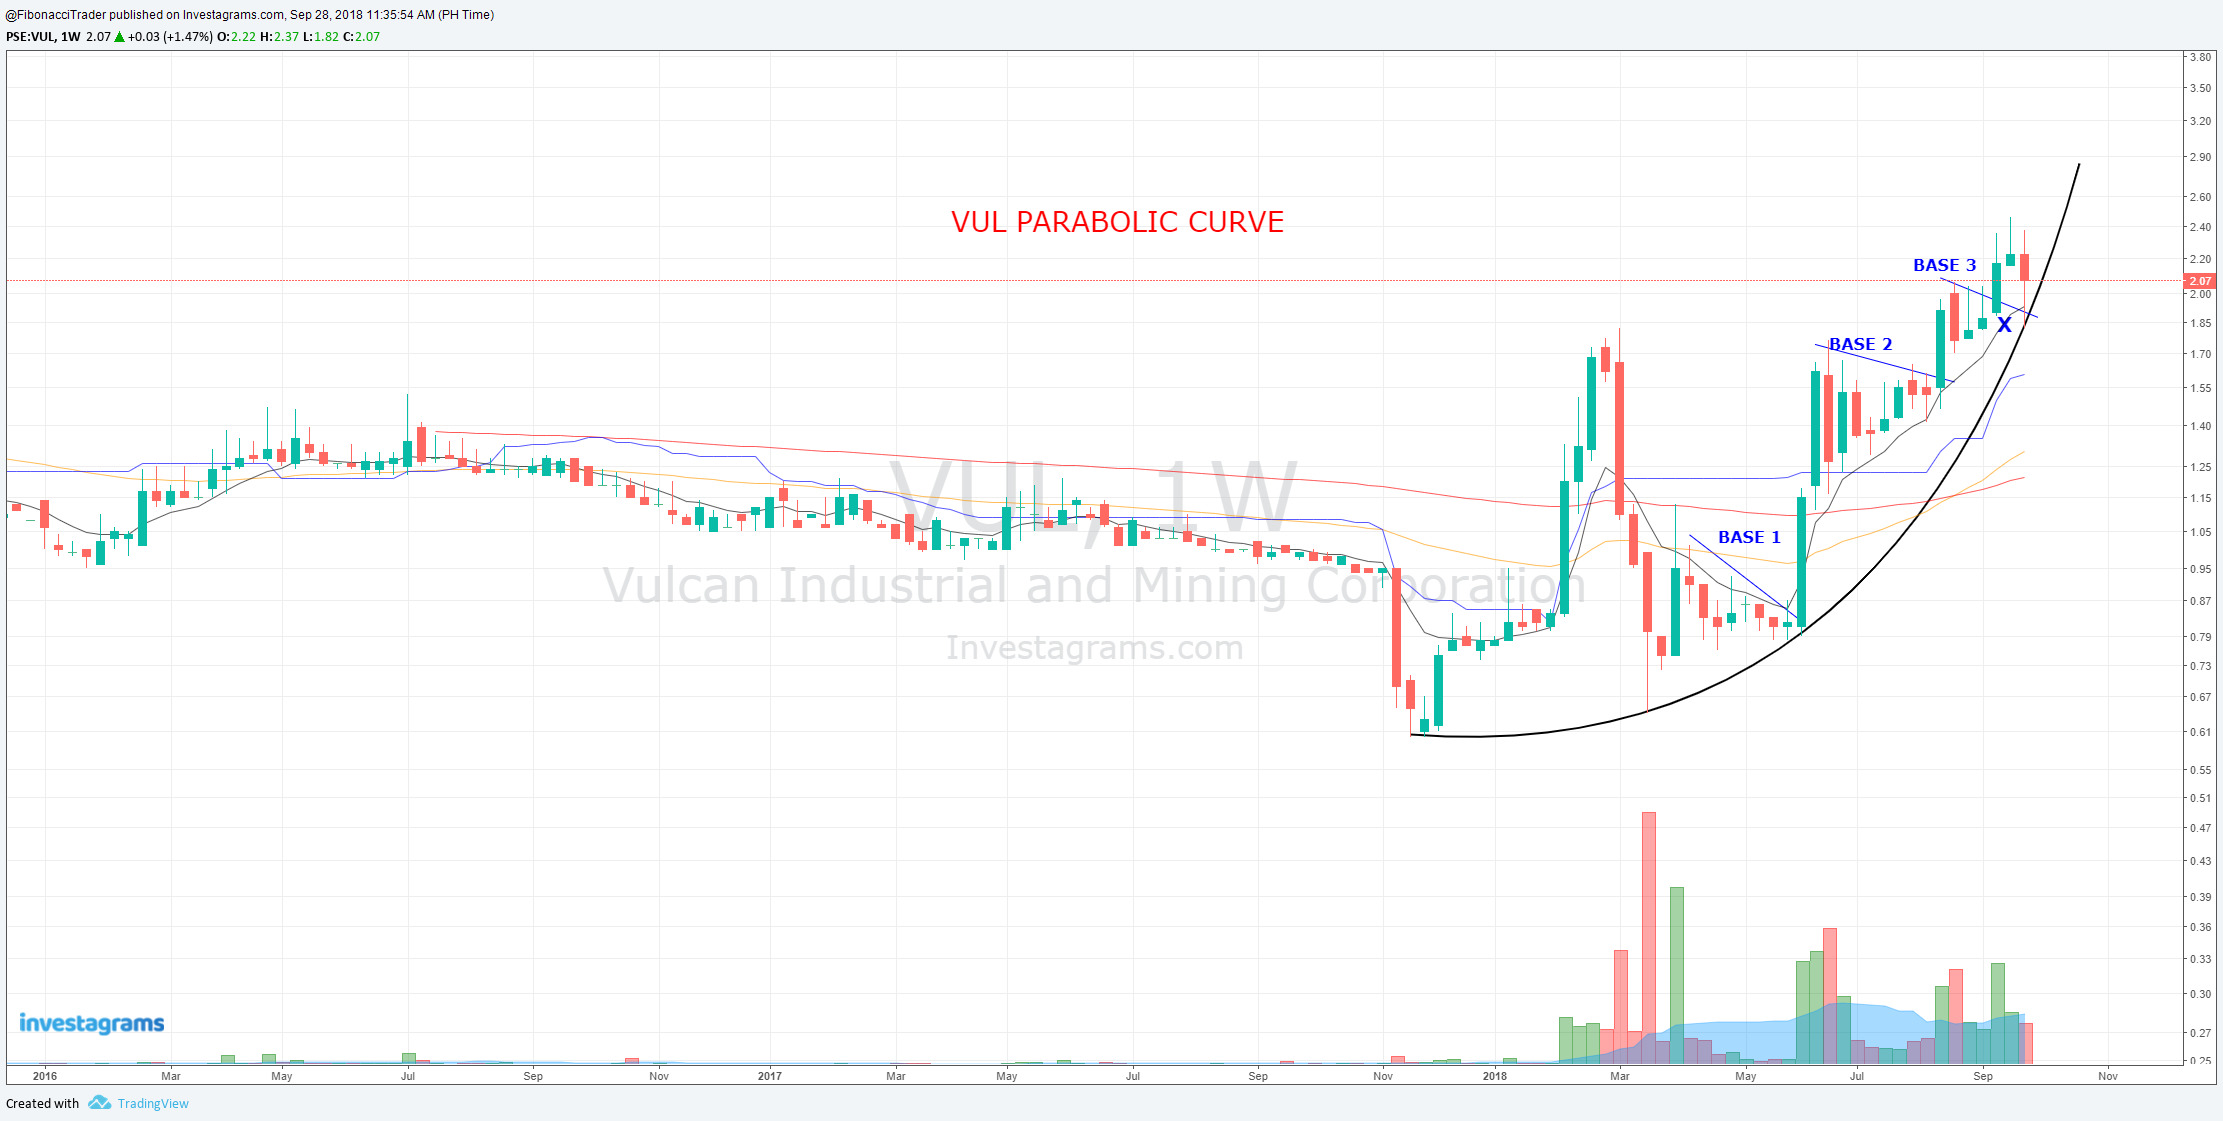
The Parabolic curve derives its name from the parabola, because the line that is used to trace out this pattern from the candlestick price action resembles a parabola. This is probably one of the most highly prized and sought after patterns. This pattern yields the biggest and quickest return in the shortest amount of time. This pattern is a result of multiple base formation breaks . The best time to enter this pattern is at the bases.

ATN Holdings, Inc. 'A' (ATN) Bullish ABCD
ATN Holdings, Inc. 'A' (ATN) completed a Bullish ABCD Pattern.

Harmonic Trading Webinar
Turning Patterns into Profit
When: Module 1 – October 13, 2018
Module 2 – October 20, 2018
Time: 8:00 PM Manila Time
Topics:
Module 1: October 13, 2018
Harmonic Trading
Fibonacci
Fibonacci Retracement
Potential Reversal Zone (PRZ)
AB=CD Pattern
Alternate AB=CD Pattern
Gartley Pattern
Bat Pattern
Alt Bat Pattern
Module 2: October 20, 2018
Butterfly Pattern
Crab Pattern
Deep Crab Pattern
Shark Pattern
Alt Shark Pattern
Cypher Pattern
Three Drives Pattern
5-0 Pattern
Money Management
Webinar Fee: Early Bird Promo P6,500. Payment till October 12, 2018
Regular Rate: P8,000
Mode of Payment
BDO: Account Number: 008220133452
Account Name: Randy Q. Marzan
Branch: Puregold Vigan
Paypal: rhyanmarzan@hotmail.com
711 Branches in the Philippines through Coins.ph
GCASH: 09154169693
Western Union and Moneygram
For More Information, Email me at fibonaccitrader618@gmail.com
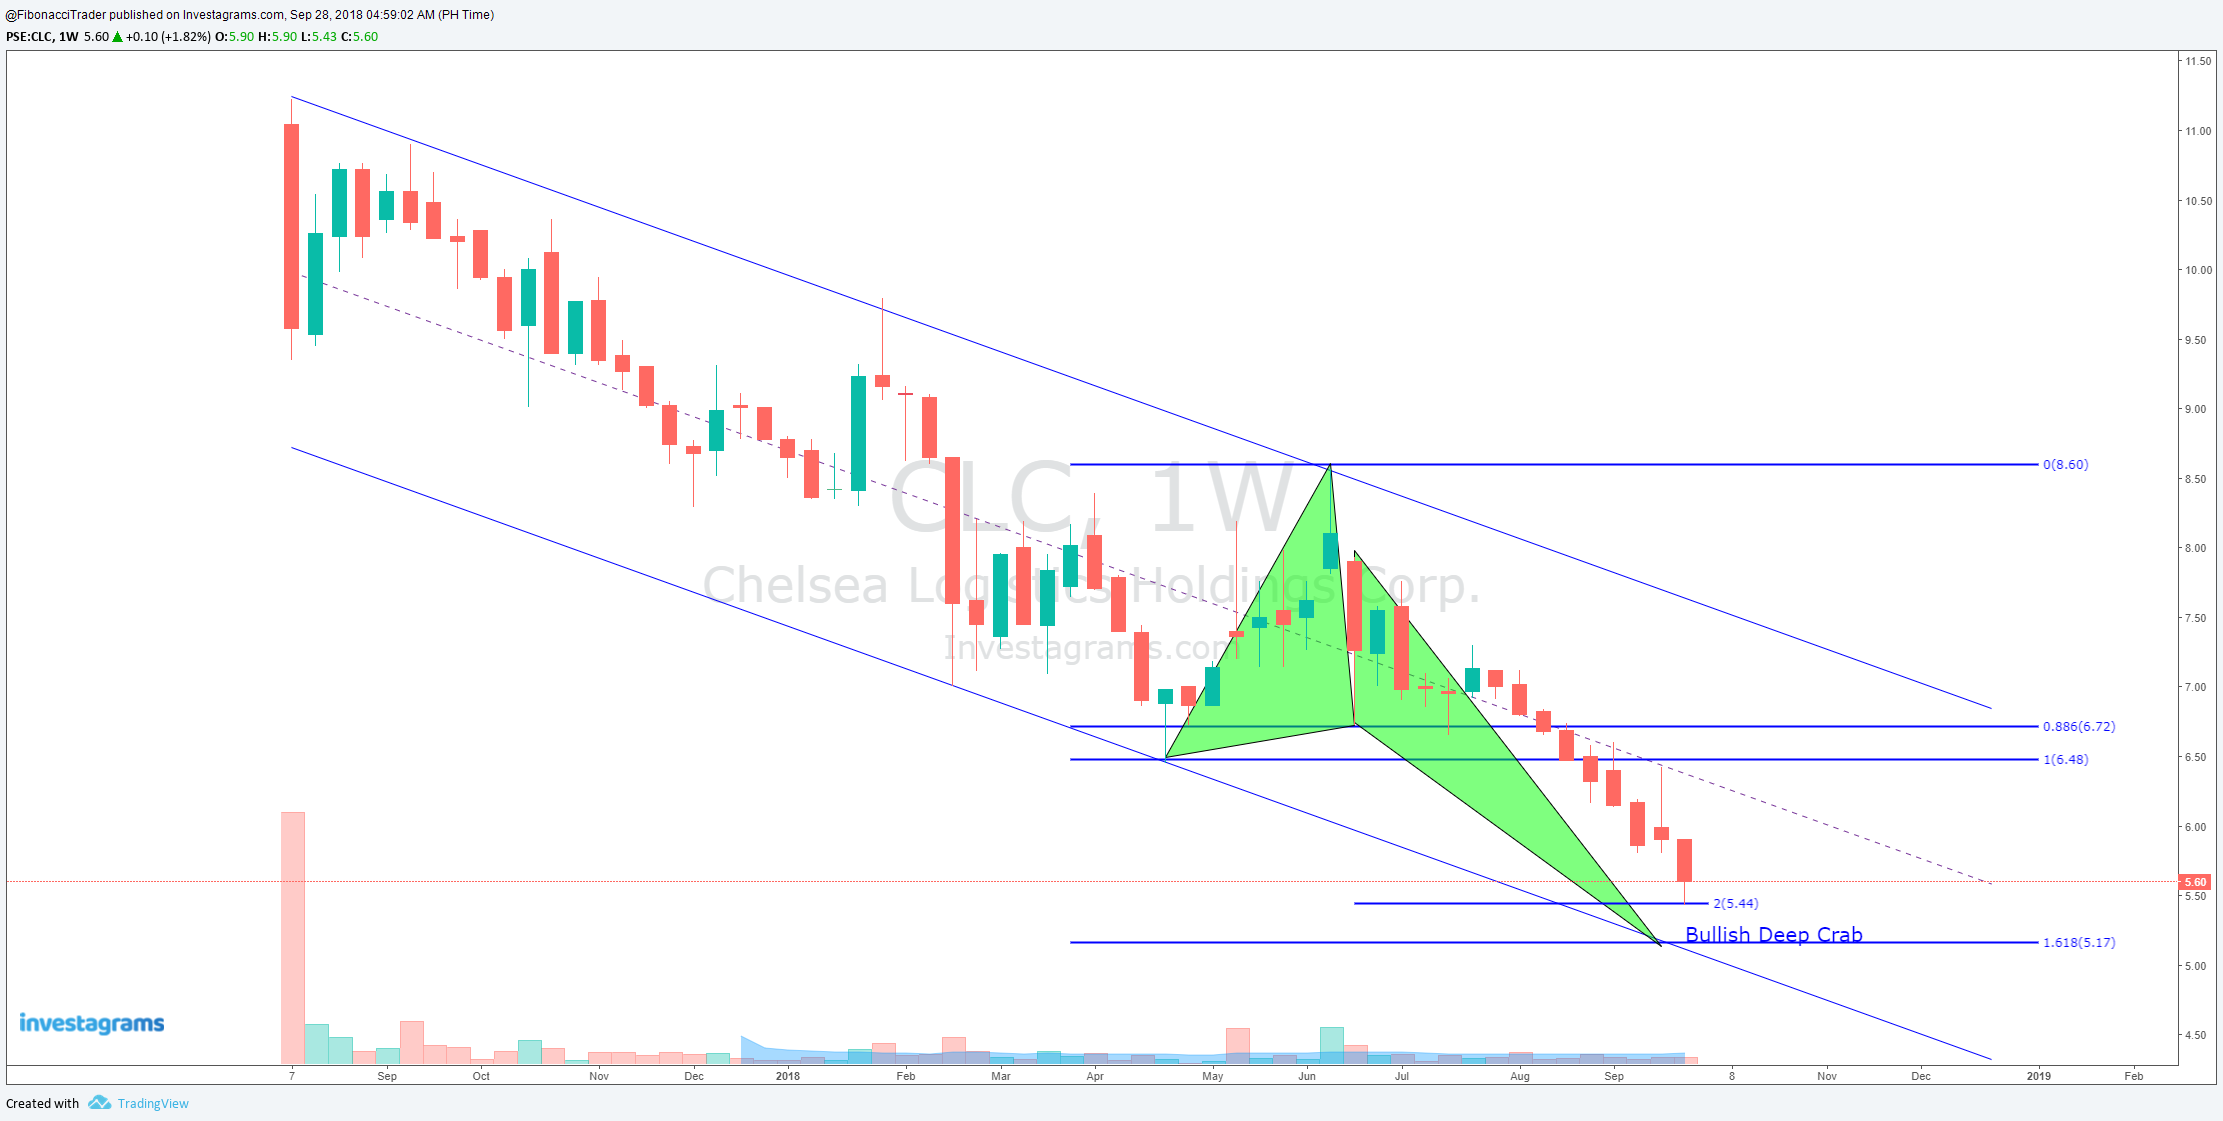
Chelsea Logistics Holdings Corp. (CLC) Potential Bullish Deep Crab
Chelsea Logistics Holdings Corp. (CLC) maybe be making a Potential Bullish Deep Crab that aims to be completed at 5.44 to 5.17.
Harmonic Trading Webinar
Turning Patterns into Profit
When: Module 1 – October 13, 2018
Module 2 – October 20, 2018
Time: 8:00 PM Manila Time
Topics:
Module 1: October 13, 2018
Harmonic Trading
Fibonacci
Fibonacci Retracement
Potential Reversal Zone (PRZ)
AB=CD Pattern
Alternate AB=CD Pattern
Gartley Pattern
Bat Pattern
Alt Bat Pattern
Module 2: October 20, 2018
Butterfly Pattern
Crab Pattern
Deep Crab Pattern
Shark Pattern
Alt Shark Pattern
Cypher Pattern
Three Drives Pattern
5-0 Pattern
Money Management
Webinar Fee: Early Bird Promo P6,500. Payment till October 12, 2018
Regular Rate: P8,000
Mode of Payment
BDO: Account Number: 008220133452
Account Name: Randy Q. Marzan
Branch: Puregold Vigan
Paypal: rhyanmarzan@hotmail.com
711 Branches in the Philippines through Coins.ph
GCASH: 09154169693
Western Union and Moneygram
For More Information, Email me at fibonaccitrader618@gmail.com
Thursday, September 27, 2018
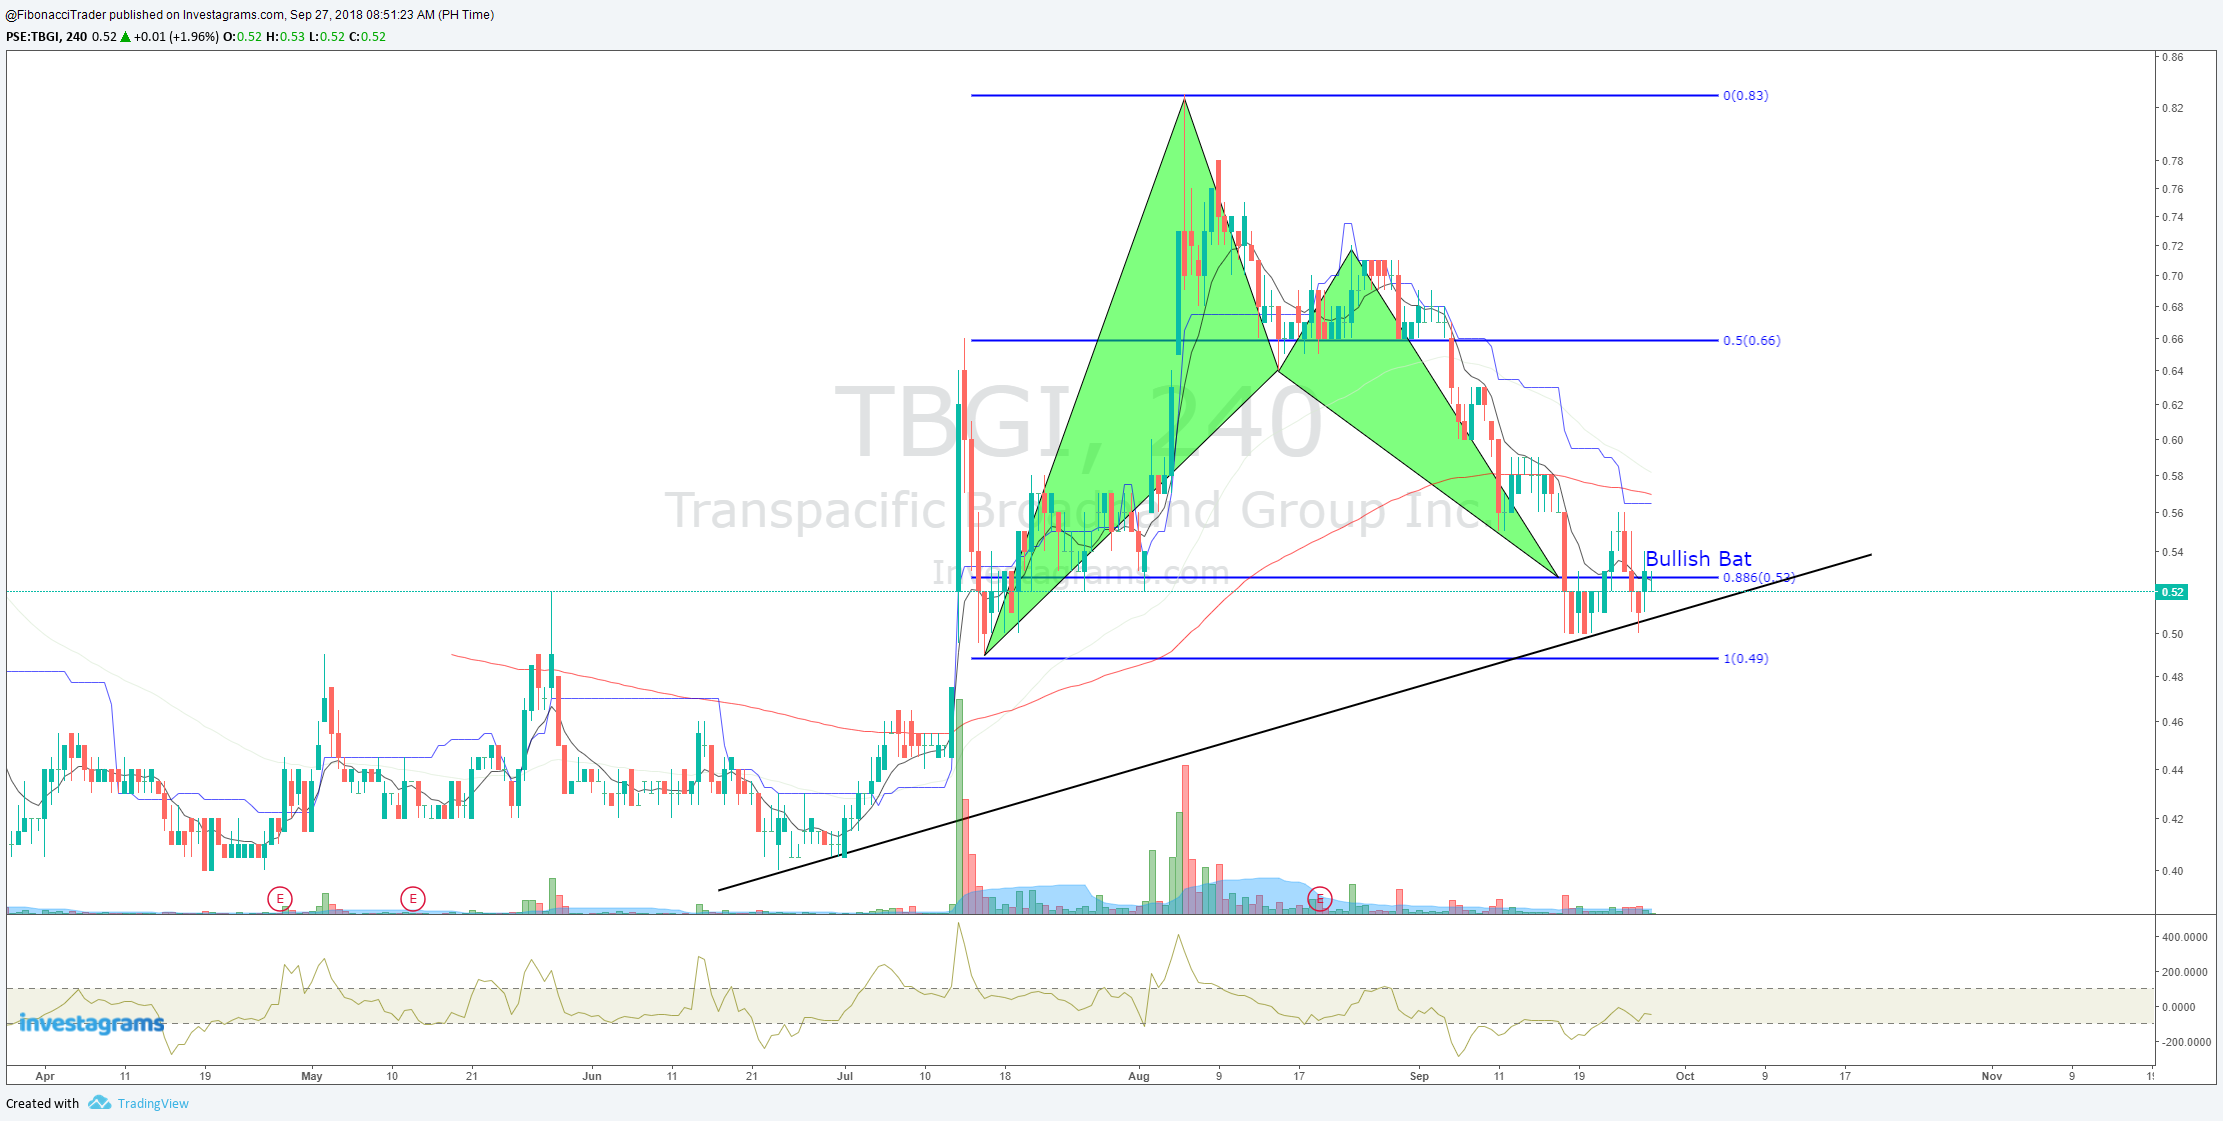
Transpacific Broadband Group Inc. (TBGI) Bullish Bat
Transpacific Broadband Group Inc. (TBGI) Bullish Bat completed a Bullish Bat harmonic Pattern at 0.53.
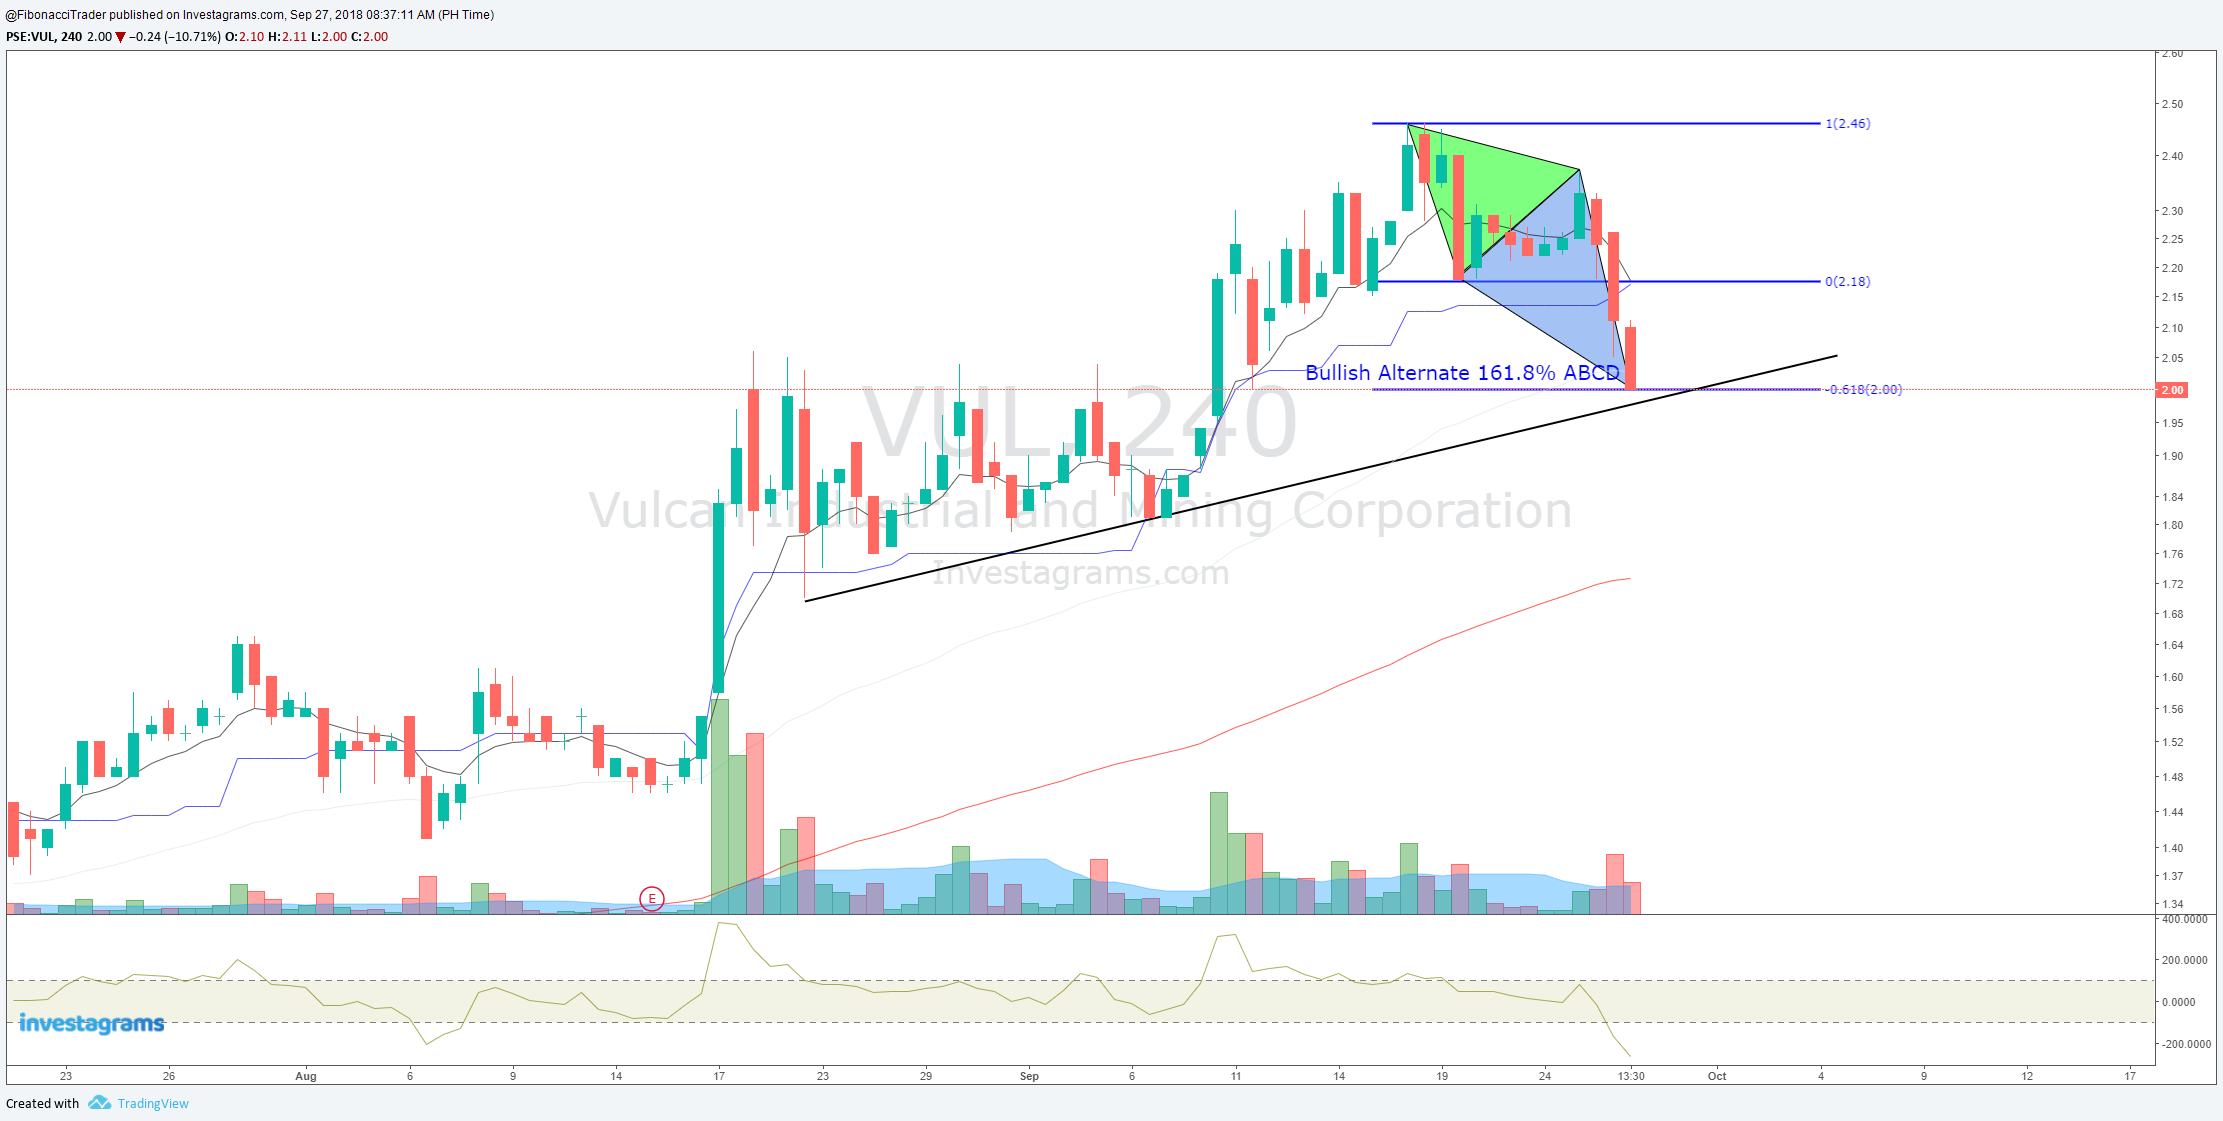
Vulcan Industrial and Mining Corporation (VUL) Bullish Alternate 161.8% ABCD
It seems that Vulcan Industrial and Mining Corporation (VUL) completed a Bullish Alternate 161.8% ABCD at 2.00.
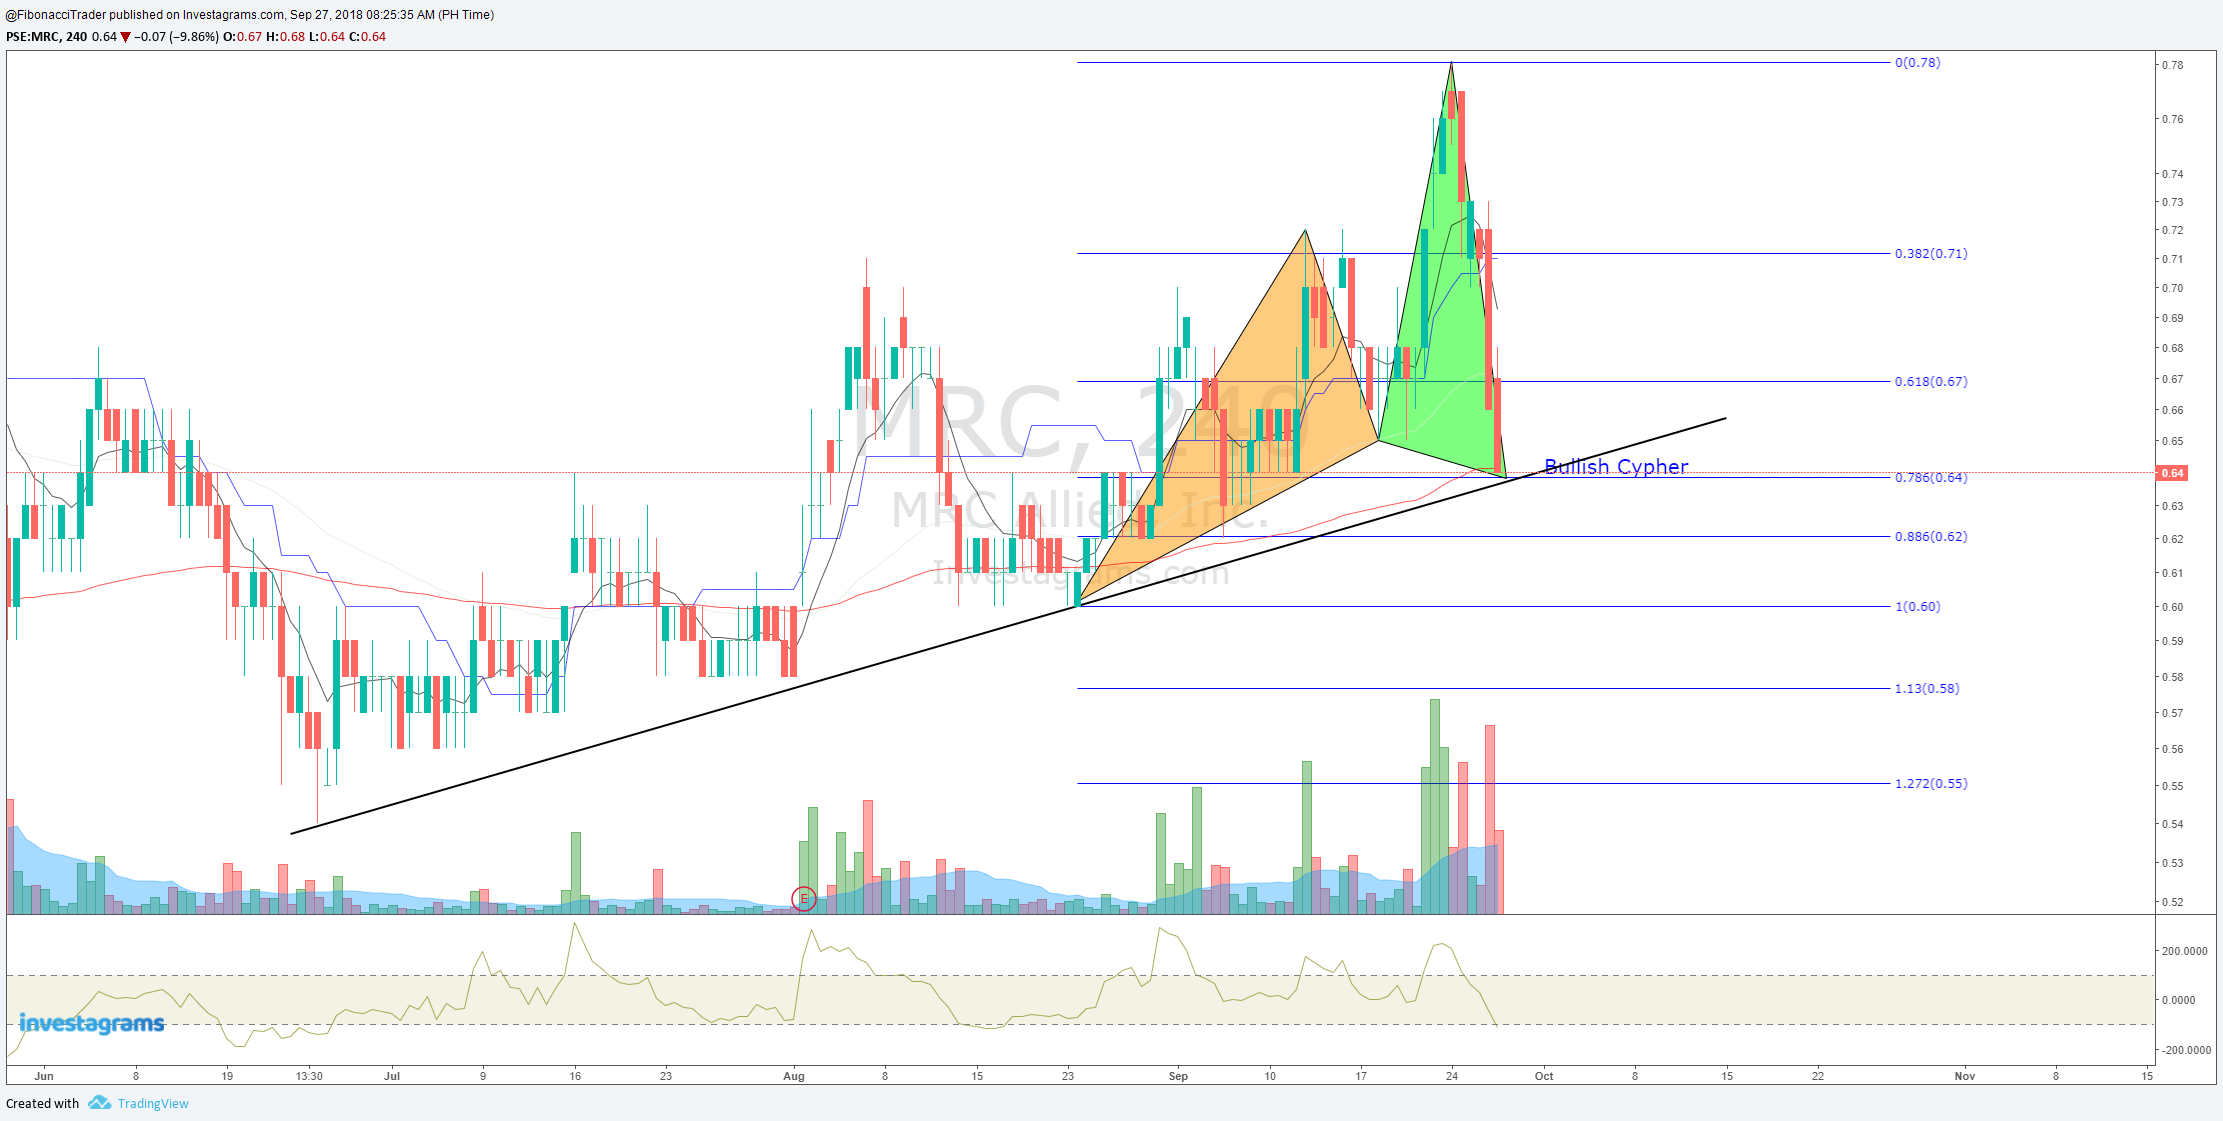
MRC Allied, Inc (MRC) Bullish Cypher
Looks like MRC Allied, Inc (MRC) completed a Bullish Cypher Harmonic Pattern at 0.64.
Monday, September 24, 2018
STI Education Systems Holdings, Inc. (STI) Bullish Cypher
STI Education Systems Holdings, Inc. (STI) respected the Potential Reversal Zone of a Bullish Cypher Harmonic Pattern. STI also completed the Wave C of the corrective ABC of Elliot Wave.
Profit target 1 at 1.10 then at 1.42.

Profit target 1 at 1.10 then at 1.42.

Sunday, September 23, 2018
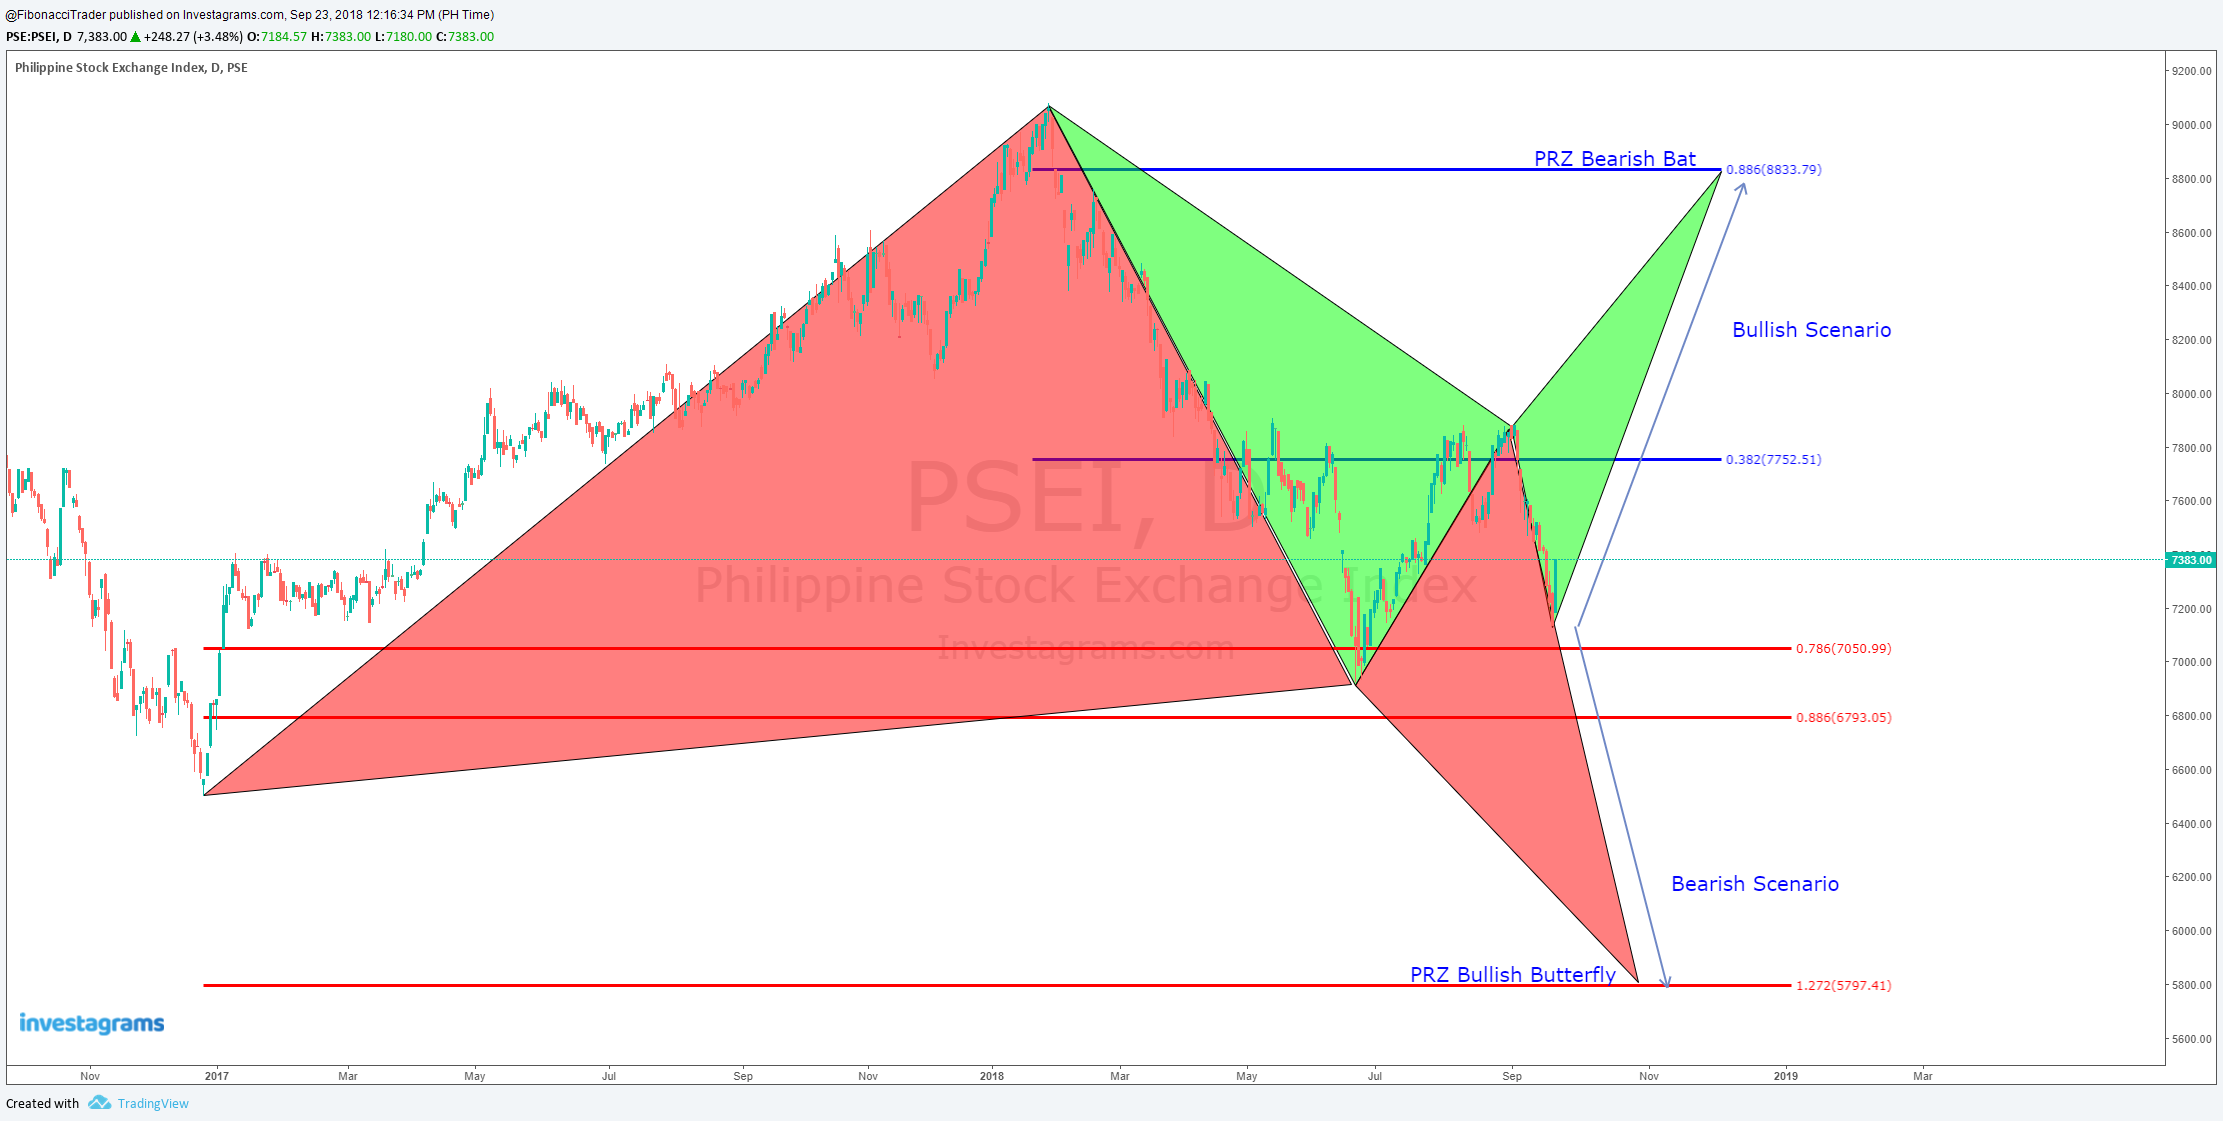
Philippine Stock Exchange Index (PSEi) Bullish and Bearish Scenario
The Philippine Stock Exchange Index (PSEi) may be forming a Potential Bullish Butterfly (Bearish Scenario) that aims to be completed at 5797 and a Potential Bearish Bat (Bullish Scenario) with Potential Reversal Zone at 8833.
Friday, September 21, 2018
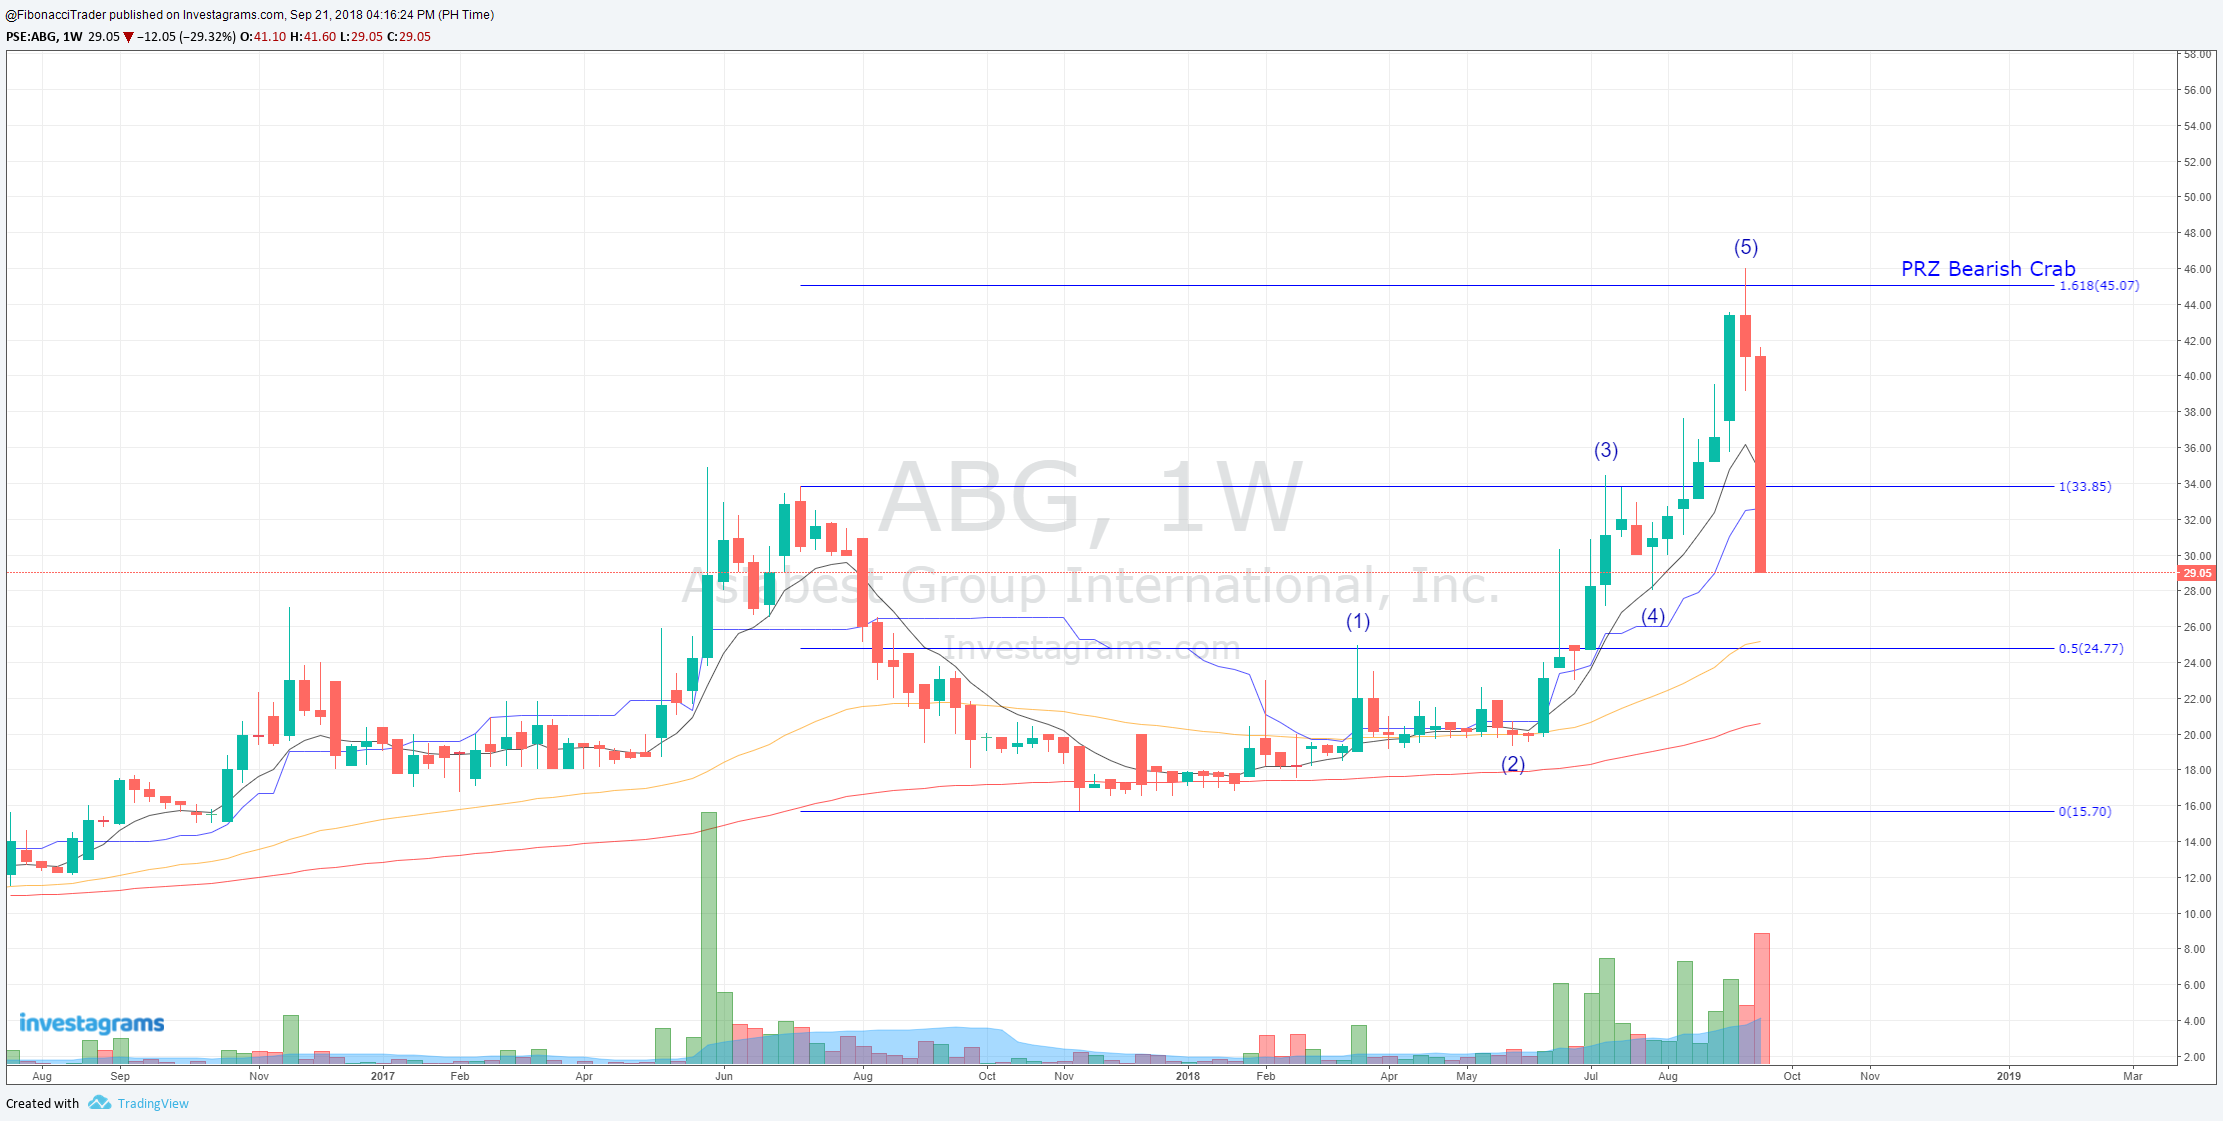
Asiabest Group International, Inc. (ABG) Bearish Crab
Asiabest Group International, Inc. (ABG) completed a Bearish Crab Harmonic Pattern in confluence with the end of Wave 5 of Elliot Wave.
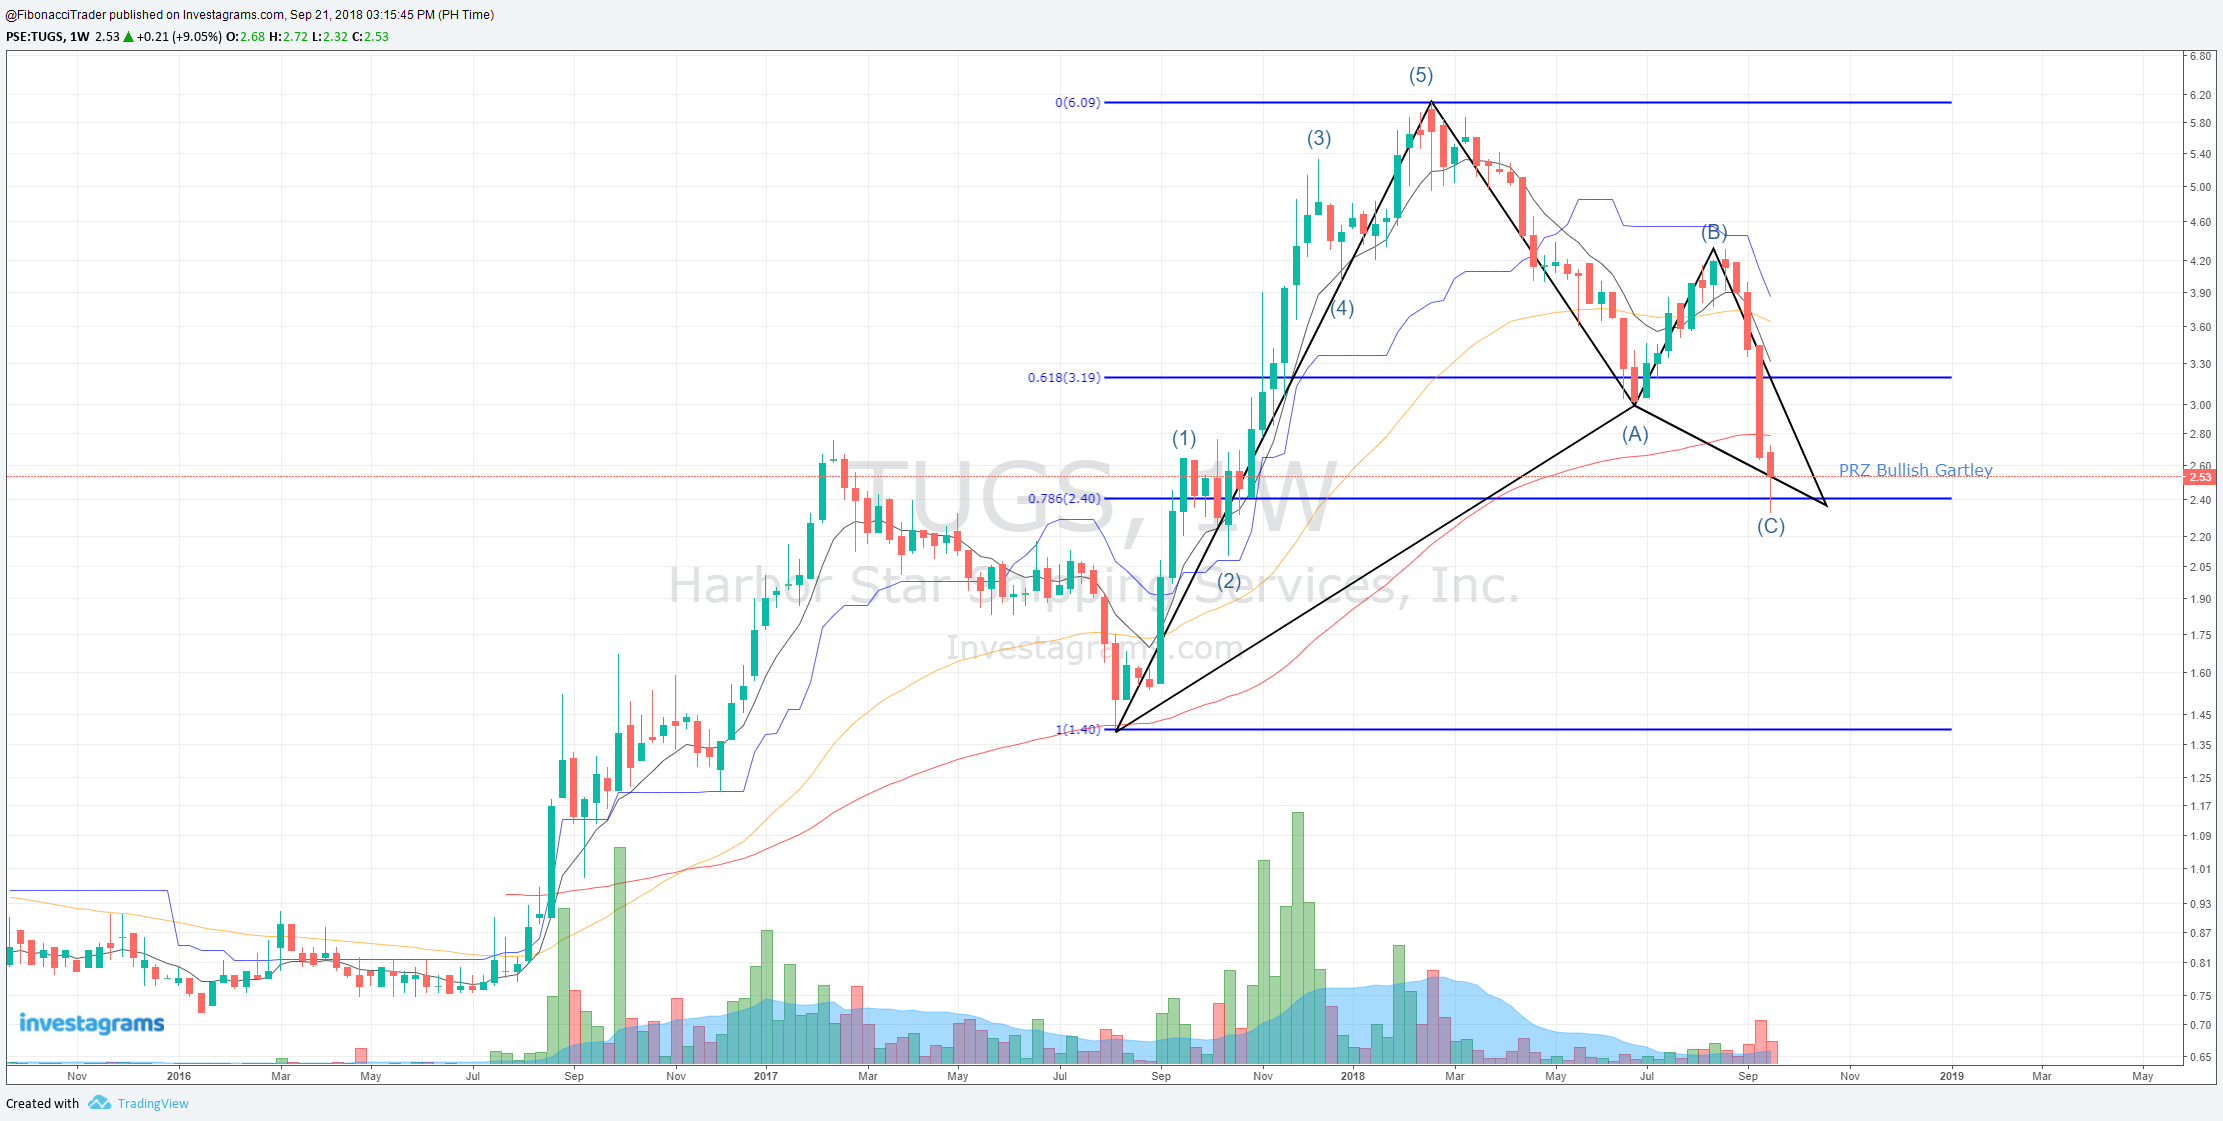
Harbor Star Services (TUGS) Bullish Gartley
Harbor Star Services (TUGS) respected the Potential Reversal Zone of A Bullish Gartley Harmonic Pattern. Pattern. Wave C of the corrective ABC of Elliot Wave also ended.
Transpacific Broadband Group (TBGI) Bullish Bat
Transpacific Broadband Group (TBGI) Bullish Bat respected the Potential Reversal Zone of Bullish Bat Harmonic Pattern. The Wave C of the corrective ABC of Elliot Wave also ended.


Wednesday, September 19, 2018
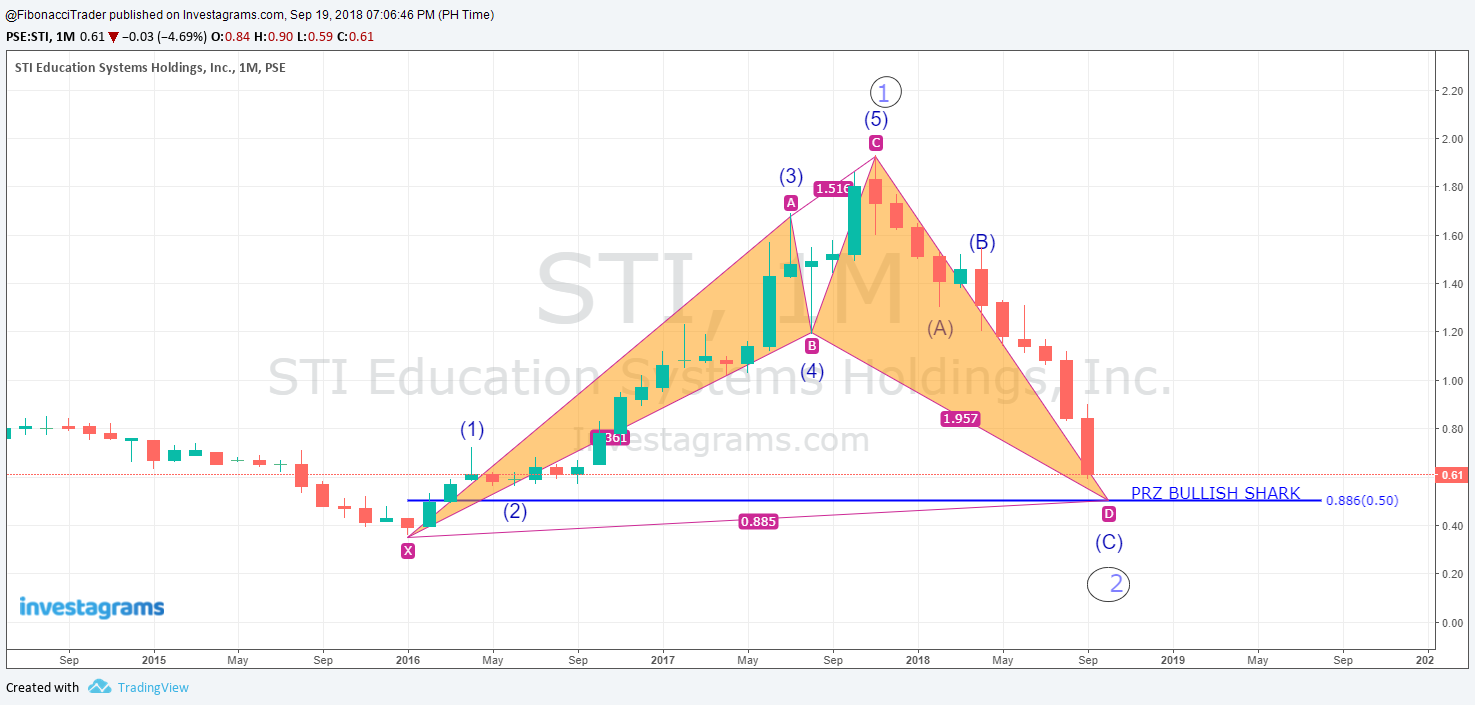
STI Education Systems Holdings, Inc (STI) Corrective ABC
Looks like the Wave C of the corrective ABC of Elliot Wave is about to end at 0.50 level which is also in confluence with the Potential Reversal Zone (PRZ) of a Bullish Shark Harmonic Pattern.
Monday, September 17, 2018
The Parabolic Curve Pattern Vulcan Industrial and Mining Corporation (VUL?)
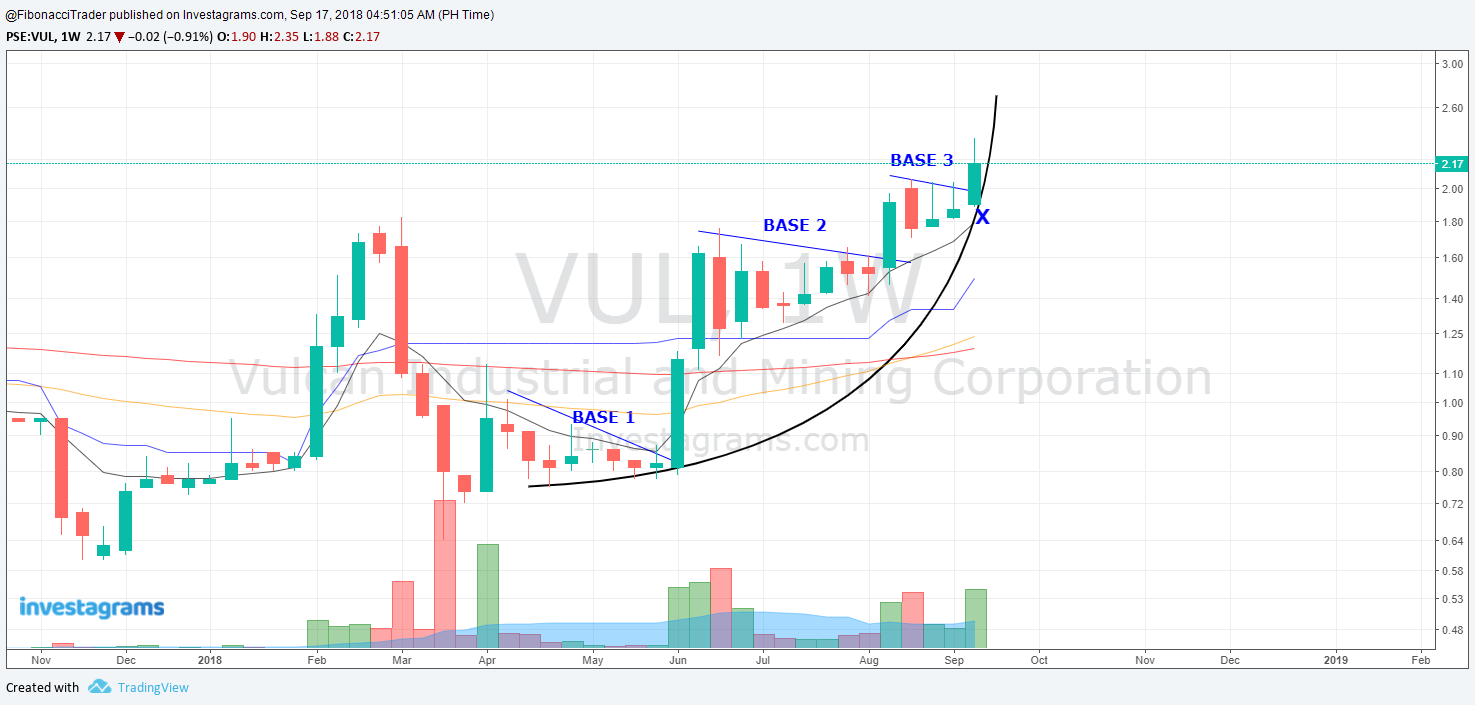
The Parabolic curve derives its name from the parabola, because the line that is used to trace out this pattern from the candlestick price action resembles a parabola. This is probably one of the most highly prized and sought after patterns. This pattern yields the biggest and quickest return in the shortest amount of time. This pattern is a result of multiple base formation breaks . The best time to enter this pattern is at the bases.

Subscribe to:
Posts (Atom)