Showing posts with label SMC. Show all posts
Showing posts with label SMC. Show all posts
Sunday, November 18, 2018
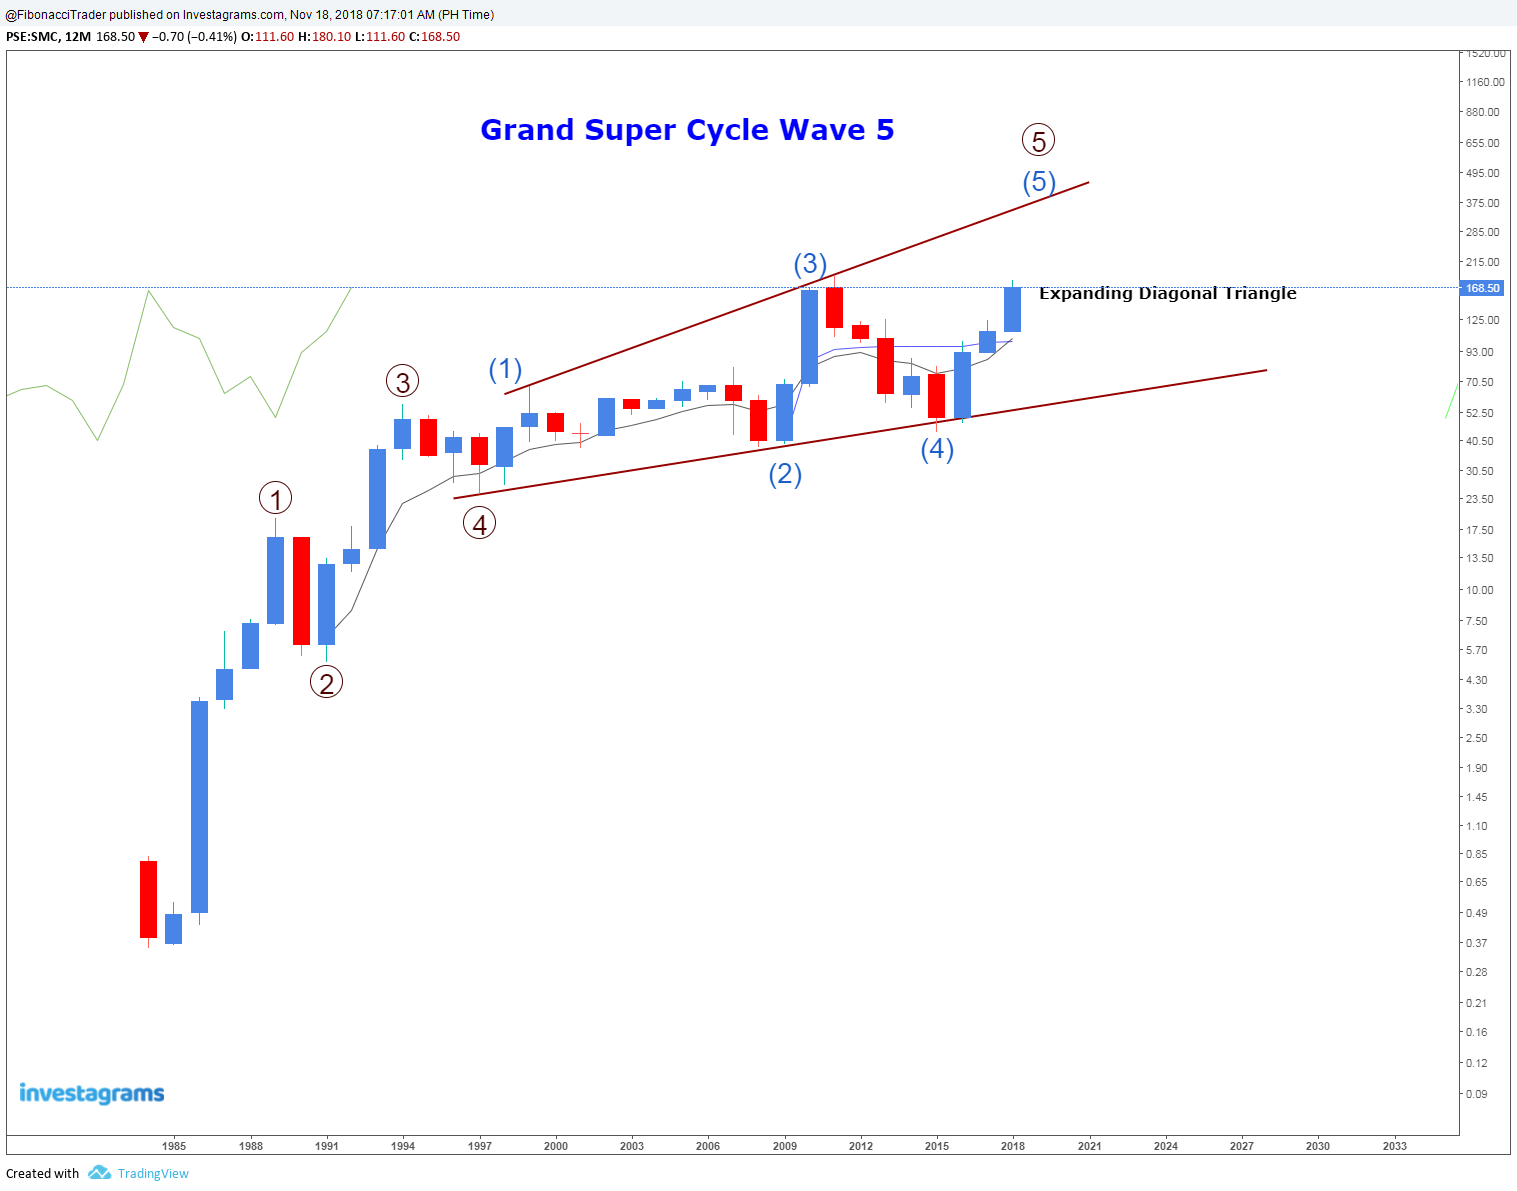
San Miguel Corporation (SMC) Grand Super Cycle Wave 5
It's seems the SMC is on it's way to Grand Super Cycle Wave 5 and currently making a expanding Diagonal Triangle.

Sunday, January 21, 2018
SMC Potential Bearish Shark - January 21, 2018
$SMC If 133 is Broken, this could go to 174 - 207 for the completion of Bearish Shark.
Support is seen at 130.

Support is seen at 130.

Monday, July 21, 2014
SMC Potential Bearish Shark & Inverted Head and Shoulder - July 21, 2014
Weekly Chart
Cup and Handle

Weekly Chart
Inverted Head and Shoulder

Cup and Handle
Weekly Chart
Inverted Head and Shoulder
Sunday, May 11, 2014
San Miguel Corporation (SMC) - May 11, 2014
Technical View
Daily Chart
> Looks like SMC is forming a Potential Bearish Shark Harmonic Pattern with PRZ at 118.22.
> It seems that SMC is forming a Cup and Handle. The possible target of Cup and Handle coincides with the PRZ of Potential Bearish Shark.
> Resistance at 87 and support at 80.
Relative Strenght Index (RSI) - Based on 30-Day Period

Daily Chart
> Looks like SMC is forming a Potential Bearish Shark Harmonic Pattern with PRZ at 118.22.
> It seems that SMC is forming a Cup and Handle. The possible target of Cup and Handle coincides with the PRZ of Potential Bearish Shark.
> Resistance at 87 and support at 80.
Relative Strenght Index (RSI) - Based on 30-Day Period
> RSI is currently at 62.97.
> RSI just completed Bearish Crab Harmonic Pattern.
> 60.14 or 100% Fibonacci Extension is acting as support while 64.59 or 113% Fibonacci Extension is serving as resistance.
#Caveat
Like us on Facebook : www.facebook.com/FibonacciTrader
Disclaimer: Not a solicitation to buy or sell. Use at your own risk. This is for educational purposes only.
Like us on Facebook : www.facebook.com/FibonacciTrader
Disclaimer: Not a solicitation to buy or sell. Use at your own risk. This is for educational purposes only.
Sunday, April 13, 2014
San Miguel Corporation (SMC) - April 13, 2014
Technical View
Quarterly Chart
>Last February 4, 2014 SMC bounced from the Potential Reversal Zone (PRZ) of a Bullish Shark Harmonic Pattern. The PRZ is also in confluence with Fibonacci Time Zone (Vertical Blue Lines).

Weekly Chart
>The 38.2% Retracement seems to be supporting the downside. Further support at 50MA and Median Line of Andrew's Pitchfork.
>Resistance at 50.0% Fibonacci Retracement.
>RSI is currently at 51.24 (Resistance at 58).

#Caveat
Like us on Facebook : www.facebook.com/FibonacciTrader
Disclaimer: Not a solicitation to buy or sell. Use at your own risk. This is for educational purposes only.
Quarterly Chart
>Last February 4, 2014 SMC bounced from the Potential Reversal Zone (PRZ) of a Bullish Shark Harmonic Pattern. The PRZ is also in confluence with Fibonacci Time Zone (Vertical Blue Lines).
Weekly Chart
>The 38.2% Retracement seems to be supporting the downside. Further support at 50MA and Median Line of Andrew's Pitchfork.
>Resistance at 50.0% Fibonacci Retracement.
>RSI is currently at 51.24 (Resistance at 58).
#Caveat
Like us on Facebook : www.facebook.com/FibonacciTrader
Disclaimer: Not a solicitation to buy or sell. Use at your own risk. This is for educational purposes only.
Subscribe to:
Posts (Atom)