Showing posts with label Bullish Alt 127.2% ABCD. Show all posts
Showing posts with label Bullish Alt 127.2% ABCD. Show all posts
Sunday, October 28, 2018
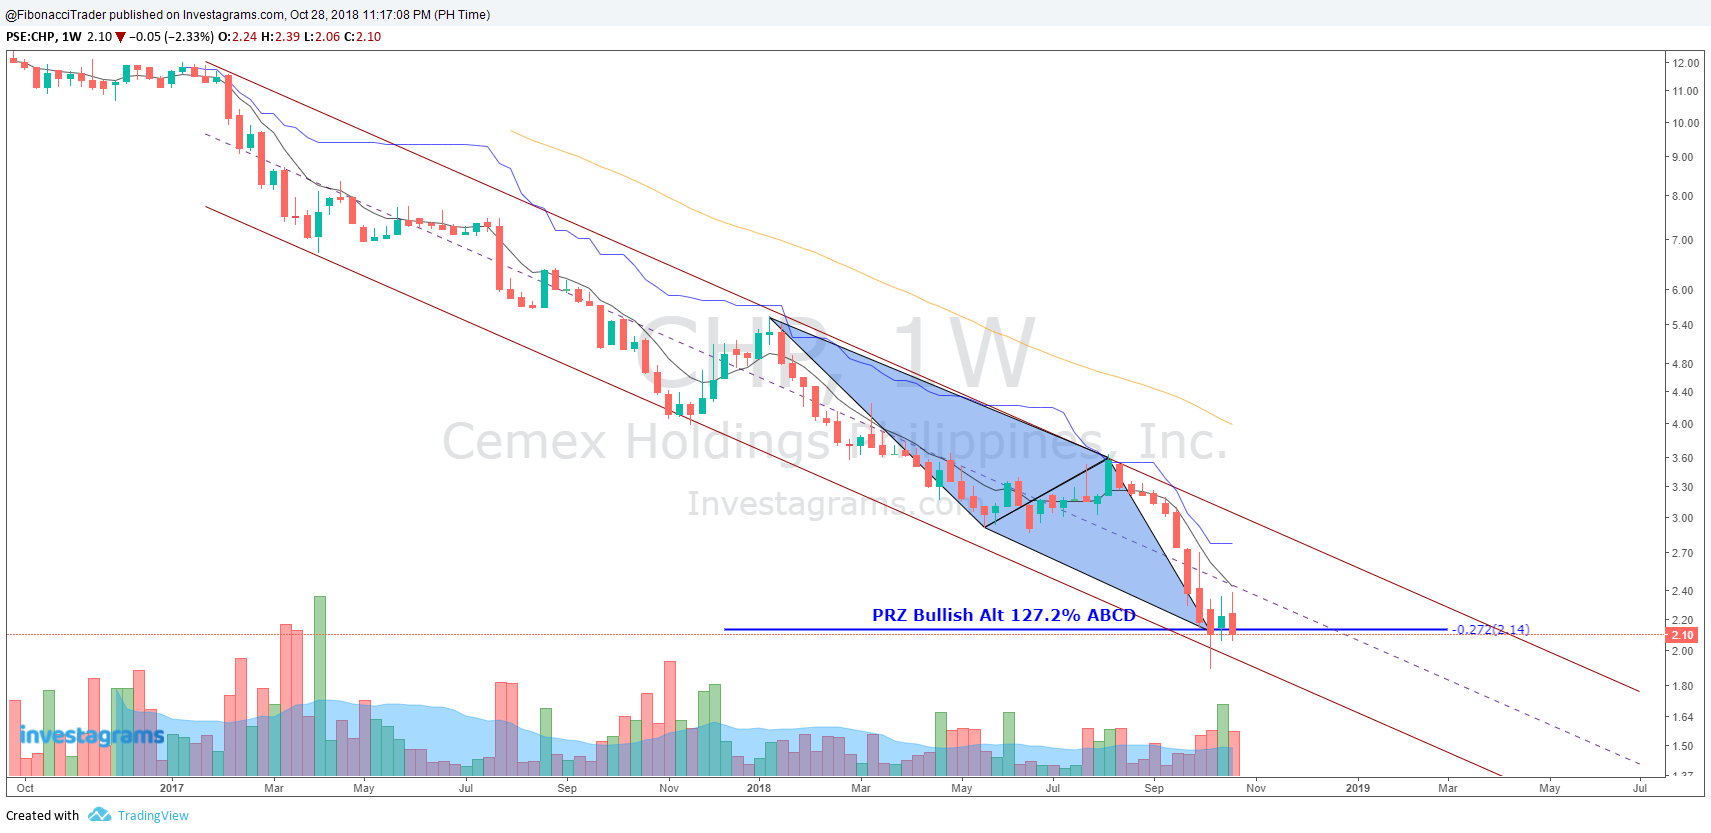
Cemex Holdings Philippines, Inc. (CHP ) Bullish Alt 127.2% ABCD
It seems that Cemex Holdings Philippines, Inc. (CHP ) completed a Bullish Alt 127.2% ABCD.

Sunday, June 10, 2018
Chart Paint Louder Than Words No. 3 - Cemex Holdings Philipppines Inc. (CHP)
Chart Paint Louder Than Words No. 3 - June 10, 2018
Stocks
Cemex Holdings Philipppines Inc. (CHP)
Last Price: 3.33
Technical Analysis:
- Completed a Bullish Alternate 127.2% ABCD Harmonic Pattern
Cemex Holdings Philipppines Inc. (CHP)
Last Price: 3.33
Technical Analysis:
- Completed a Bullish Alternate 127.2% ABCD Harmonic Pattern
Trading Plan:
- Recommendation : Buy at Current Price or Lower
- Target Price 4.22
- Stop Loss : Below 3.00
- Resistance levels are at 3.50,3.90 and 4.20
- Support levels are at 3 and 2.90

DISCLAIMER
As always, it is essential that anyone using this analysis for trading advice manages risk carefully. Trading is about probabilities, not certainties. Accept that this analysis may be wrong. It is impossible for any analyst to predict with certainty what a market will do next.
- Recommendation : Buy at Current Price or Lower
- Target Price 4.22
- Stop Loss : Below 3.00
- Resistance levels are at 3.50,3.90 and 4.20
- Support levels are at 3 and 2.90
DISCLAIMER
As always, it is essential that anyone using this analysis for trading advice manages risk carefully. Trading is about probabilities, not certainties. Accept that this analysis may be wrong. It is impossible for any analyst to predict with certainty what a market will do next.
Monday, April 9, 2018
Dow Jones Industrial (DJI) Uptrend Line - April 9, 2018
Dow Jones Industrial (DJI) is currently sitting above the support of Uptrend Line on it's monthly chart. The Potential Reversal Zone of a Bullish Alt 127.2% ABCD is being respected on it's daily chart and still above the 200 Moving Average. In my opinion the uptrend is still intact and what is happening is just a correction an oppurtunity for us to buy at lower prices. Resistance is seen at 24,217 and support levels are at 23,787 and 23,239.
 |
| Monthly Chart |
 |
| Daily Chart |
Subscribe to:
Posts (Atom)