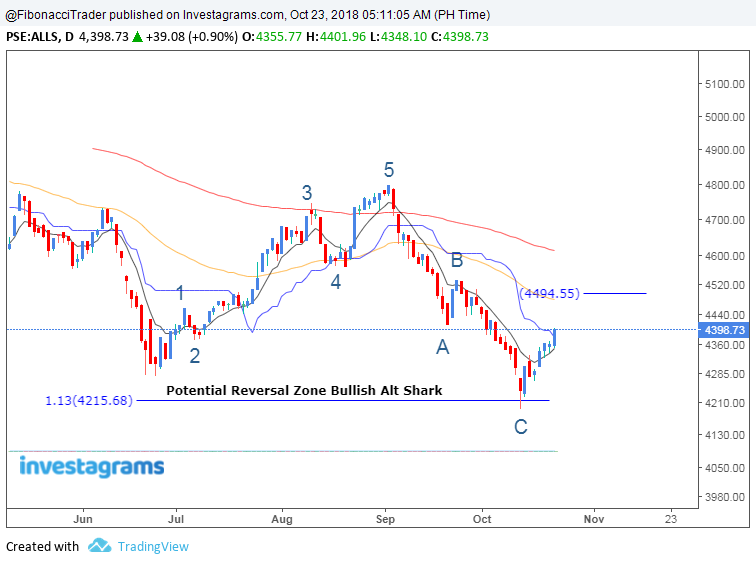
It seems that the All Shares Index completed the ABC correction of Elliot Wave in confluence with the completion of a Bullish Alt Shark Harmonic Pattern. All Shares Index needs to break 4495 to negate the downtrend.
Refer to my previous analysis : http://www.fibonaccitrader618.com/2018/10/all-shares-index-potential-bullish-shark.html
A Technical Analysis of the Financial Market Using Fibonacci, Elliott Wave, Andrew's Pitchfork, Ichimoku, Moving Average and Different Chart Patterns
Pages
Showing posts with label Bullish Shark. Show all posts
Tuesday, October 23, 2018
Wednesday, October 10, 2018
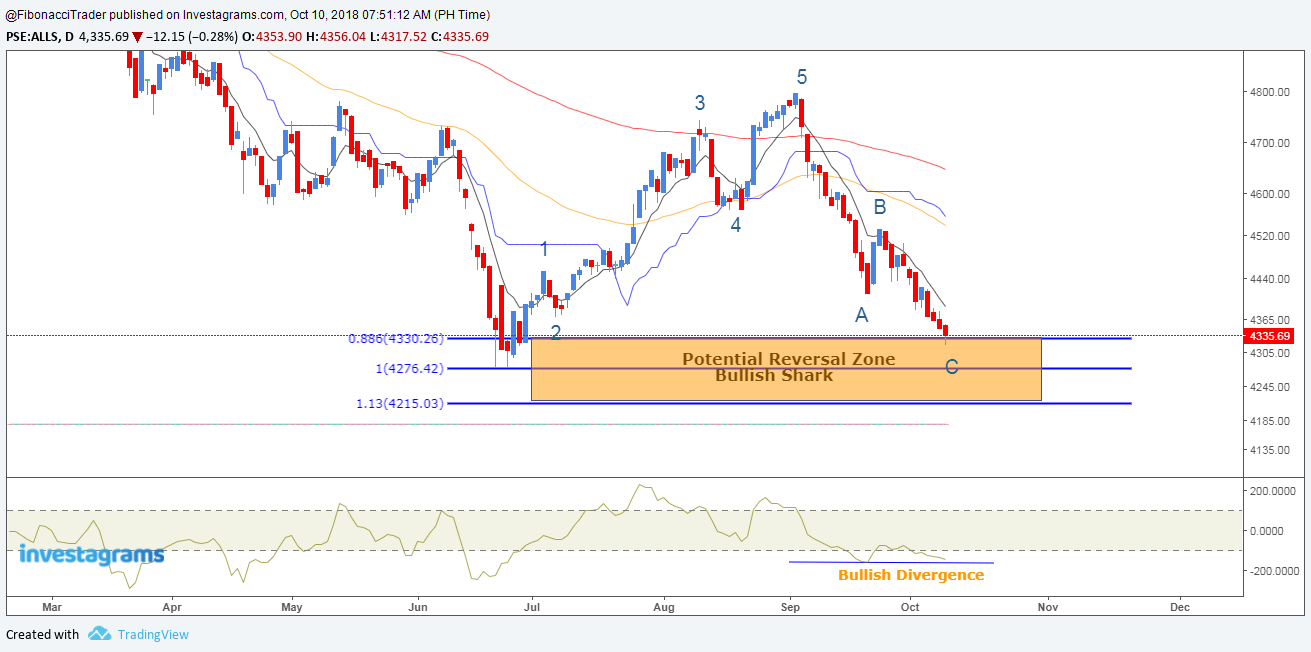
All Shares Index Potential Bullish Shark
It seems that All Shares Index is currently making a Potential Bullish Shark that aims to be completed between 4215 to 4330 level. This is also in confluence with the final wave C of the Corrective ABC of Elliot wave.
Wednesday, September 19, 2018
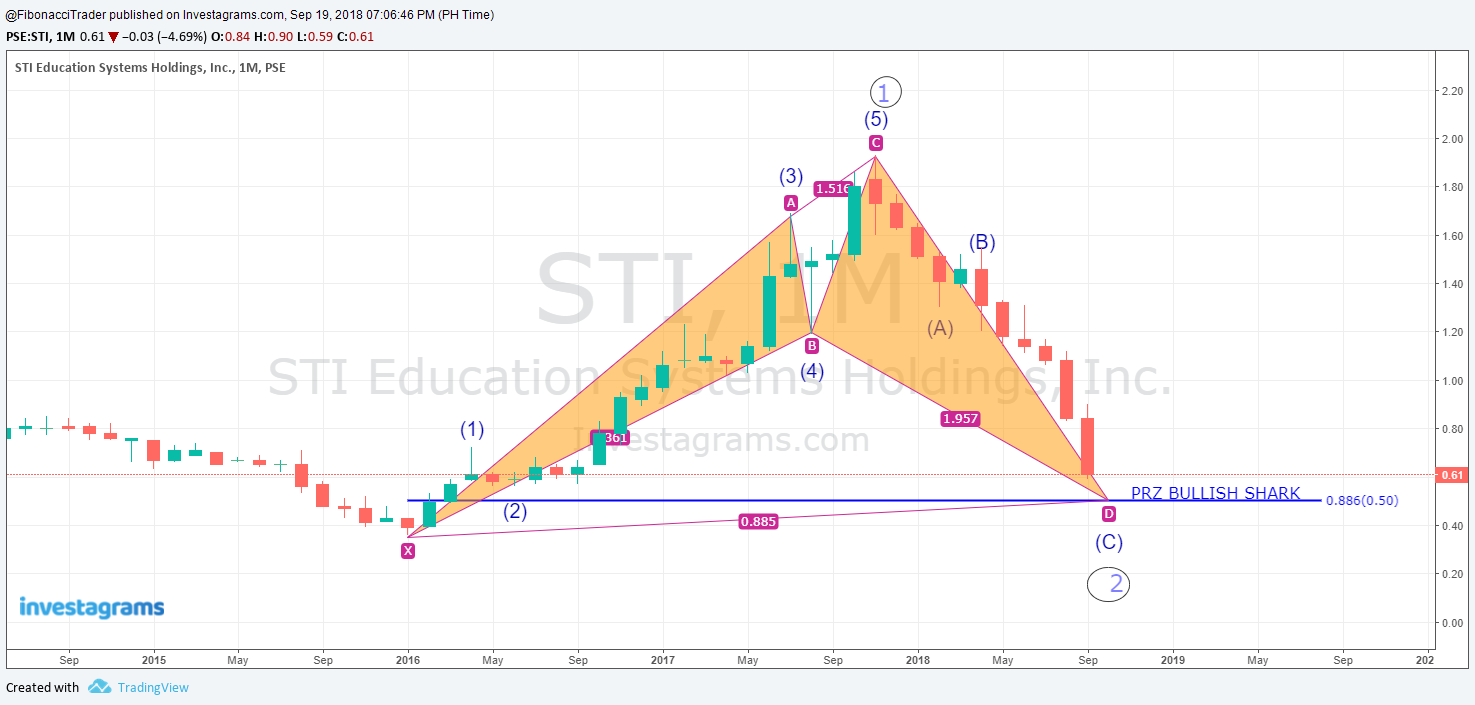
STI Education Systems Holdings, Inc (STI) Corrective ABC
Looks like the Wave C of the corrective ABC of Elliot Wave is about to end at 0.50 level which is also in confluence with the Potential Reversal Zone (PRZ) of a Bullish Shark Harmonic Pattern.
Wednesday, May 30, 2018
Dow Jones Idustrial Average Index (DJI) Potential Bullish Shark - May 30, 2018
The Dow plunged more than 392 points, or 1.6%, on fears about political turmoil in Italy and renewed trade uncertainty between the United States and China.
Looking at at daily chart looks like that it currently making a Potential Bullish Shark Harmonic Pattern that aims to be completed at 23,690.
Resistance levels are at 24,489, 24,717 and 25,086.
Support levels are at 24,305, 24,120 and 23,858.
Sunday, May 27, 2018
Bitcoin/Us Dollar (BTCUSD) Potential Bullish Shark - May 27, 2018
Bitcoin/Us Dollar (BTCUSD) maybe making a Potential Bullish Shark Pattern that aims to be completed at 6000-6800 Level.
Resistance is seen at 7686.
Support levels are at 6805, 6430 and 6000.
Trading Plan
Accumulate between 6000- 6800 level.
Resistance is seen at 7686.
Support levels are at 6805, 6430 and 6000.
Trading Plan
Accumulate between 6000- 6800 level.
Wednesday, April 4, 2018
SM Investment Corporation (SM) - Bullish Shark - April 4, 2018
SM Investment Corporation (SM) completed a Bullish Shark Harmonic Pattern. Resistance levels are at 996 and 1024. Support levels are at 961 and 935.
Technical Analysis For Forex, Cryptocurrency and Stocks.
No Hype...No Tsismis... No Drama.... Just Chart!!!!
Join FB Group Here: https://www.facebook.com/groups/155055288511760/
Sunday, February 11, 2018
ABS Potential Bullish Shark - February 11, 2018
ABS-CBN Corporation (ABS) maybe making a Potential Bullish Shark Pattern and Falling Wedge (Bullish Pattern). Buy upon completion of the Bullish Shark Pattern (30.00 -32.00 Levels) or upon Falling Wedge Breakout. Support levels are at 32.00 and 30. Resistance levels are at 33 and 35.
Caveat!
Wednesday, January 17, 2018
ETHUSD - Potential Bullish Shark - January 17, 2018
$ETHUSD - Potential Bullish Shark
The 880 to 760 level should hold or else this could go to 500 Level for the completion of a Bullish Shark.
Cryptocurrency (Bitcoin) Guide for Beginners
1. Open a Cryptocurrency Wallet
Coins.ph https://coins.ph
2. Open an account with a Cryptocurrency Exchange
Binance https://www.binance.com/?ref=21368793
Kucoin https://www.kucoin.com/#/?r=24Nxs
3. Fund your account in cryptocurrency exchange using your cryptocurrency wallet.
4. Enjoy Trading
Accept BTC Donation : 3LKSZ2aoWAvSifEDQBmACWZFN44DCdun28
Tuesday, February 28, 2017
Tesla Inc., (TSLA) – Triple Top & Potential Bullish Shark - February 28, 2017
•Maybe making a Potential Bearish Shark Harmonic Pattern that aims to be completed between 124 and 155 level.
•Sell, but watch the 100 MA Line for Possible Support.
•Wait for the Potential Bullish Pattern to be finished and buy at the PRZ.
Monday, September 12, 2016
Dow Jones Potential Bullish Shark - September 12, 2016
Dow Jones is down by -394.46 points or (-2.13%) on concerns that FED may raise interest on the 21st. DOW Futures as of today is -436 points or -2.37%.
DOW is currently at 100MA and there is a potential Bullish Shark Harmonic Pattern that is forming that aims to be completed at 15760 level.
Wednesday, July 2, 2014
Subscribe to:
Posts (Atom)