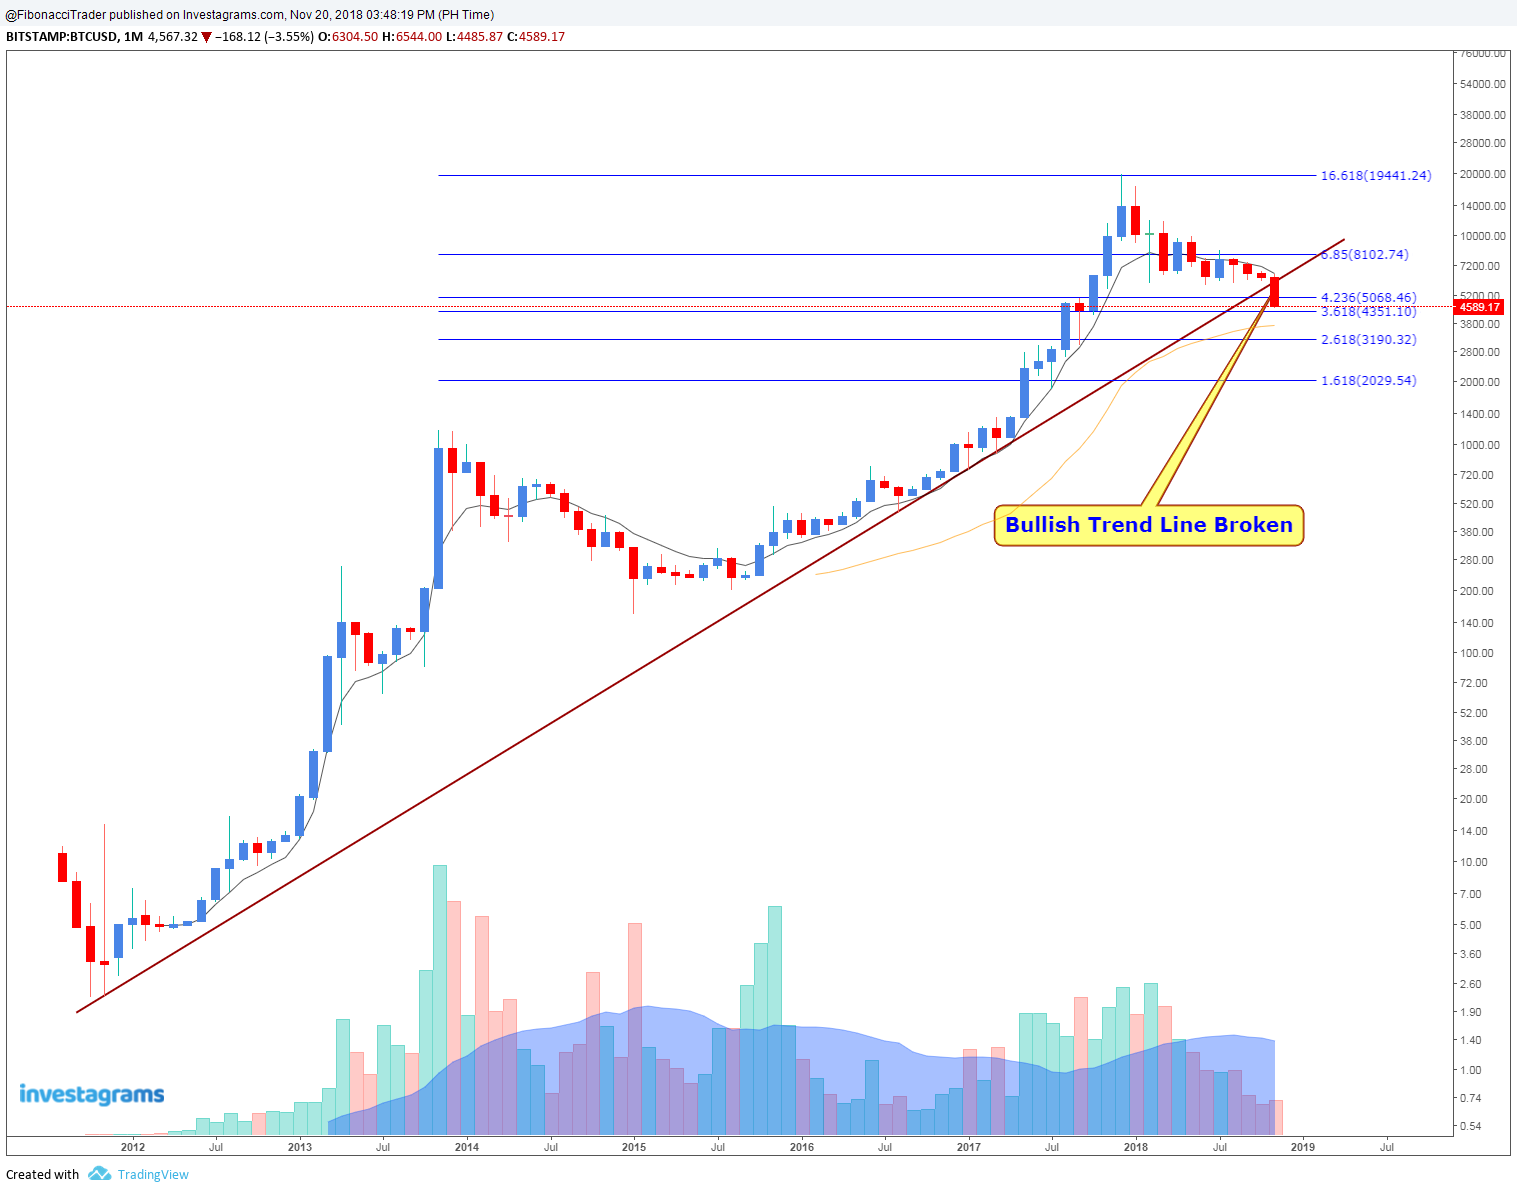
It's seems that Bitcoin / US Dollar (BTCUSD) breaks out downwards from the Bullish Trend Line.
Next support is seen at 4351.
A Technical Analysis of the Financial Market Using Fibonacci, Elliott Wave, Andrew's Pitchfork, Ichimoku, Moving Average and Different Chart Patterns
Pages
Showing posts with label Bullish Trendline. Show all posts
Tuesday, November 20, 2018
Sunday, March 5, 2017
STI Education System Holding, Inc. (STI) – Minor Bullish Trendline & 21 EMA Broken
•Sell/Avoid. Countertrend traders may try to buy on oversold levels and try selling on a rebound.
•The 21 Exponential Moving Average will now serve as resistance. Support is seen at 1.
Saturday, February 25, 2017
Cebu Air, Inc. (CEB) - Sitting on Bullish Trendline - February 25, 2017
Cebu Air, Inc. (CEB) is sitting above it's Bullish Trendline. Buy at current prices. Supports levels are at 93 then at 90 while Resistance levels are at 100 and 107.
Subscribe to:
Posts (Atom)

