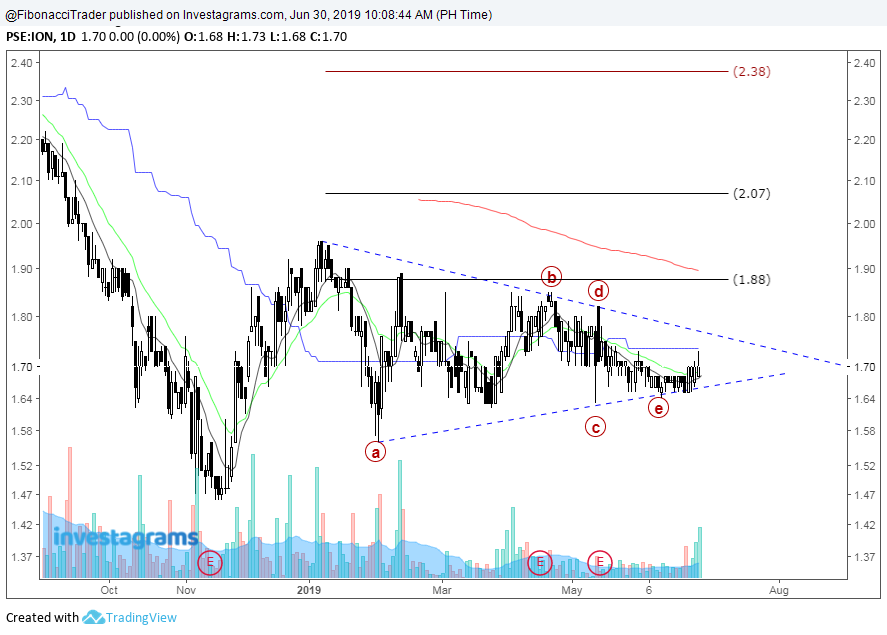
It seems that ION is consolidating within a bullish symmetrical triangle. Buy on current prices or buy on Breakout of the Triangle. If the Traingle Breaks, initial target price is 2.07 then at 2.38. Support is seen at 1.60.
A Technical Analysis of the Financial Market Using Fibonacci, Elliott Wave, Andrew's Pitchfork, Ichimoku, Moving Average and Different Chart Patterns
Pages
Sunday, June 30, 2019
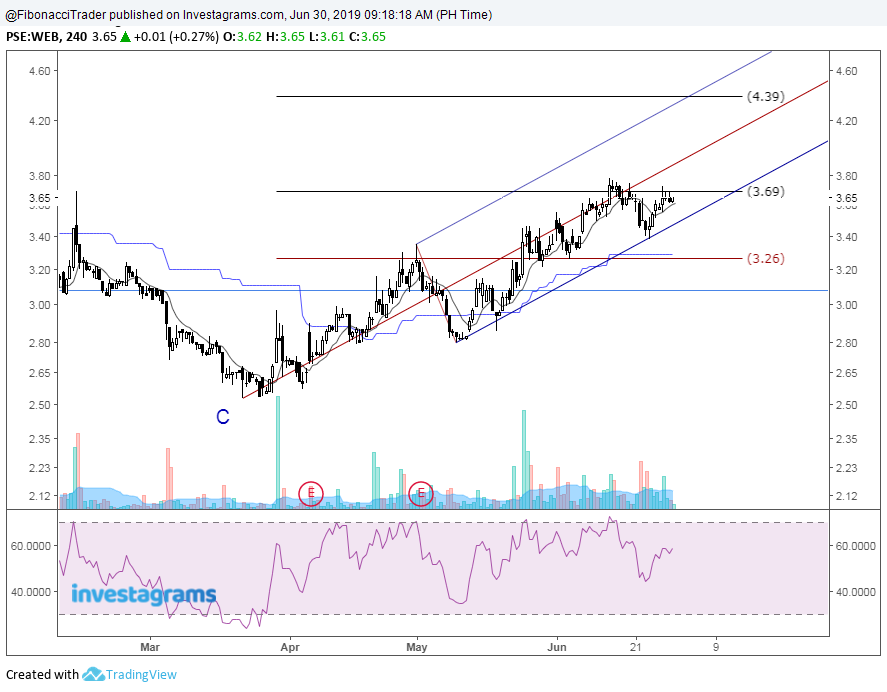
Philweb Corporation (WEB) Uptrend Intact, Bulls Watching for a Break Above 3.69
Looks like the Bulls are still in control, Philweb Corporation (WEB) Uptrend still intact. If 3.69 breaks, the initial target price is 4.39.
Saturday, June 29, 2019
A Case Study in PSE Stocks With Target Price
Let's us see if the target price of the following PSE stocks can reach their target within 3 months to 1.5 years.
Bitcoin BTCUSD Wave (1) Ends at 61.8% Fibonacci Ret. Level
Looks like BTCUSD (Bitcoin) wave 5 of the Larger Wave(1) finally ends at the 61.8% Fibonacci Retracement Level and may be making the corrective ABC or Wave (2) of the Larger Wave. Wave (2) might be between 9804, 8545 and 7285.
Monday, June 10, 2019
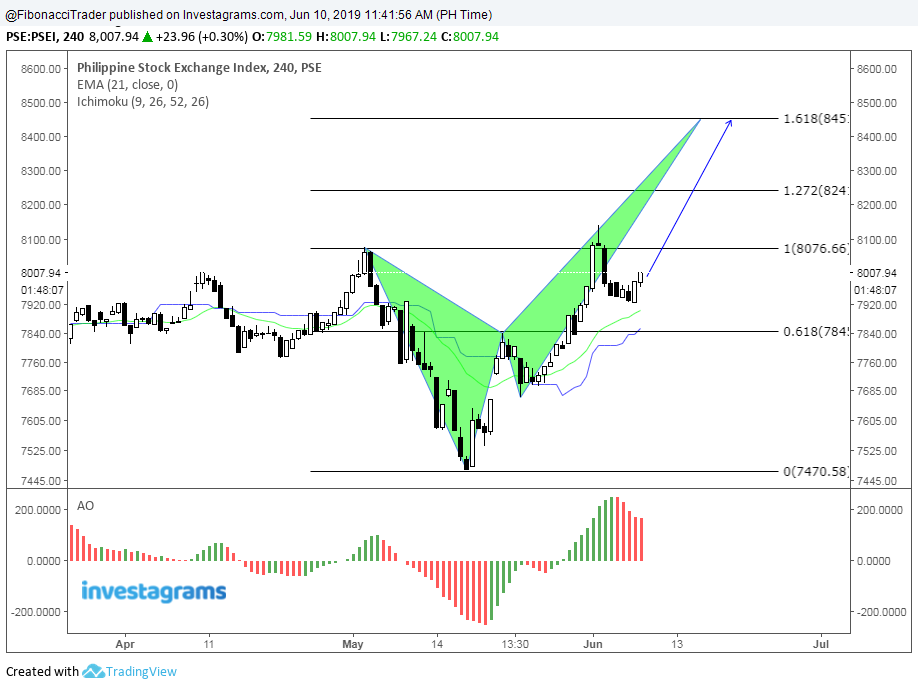
PSEI Could Reach 8450 Level
Looks like the index (PSEi) is currently making a Potential Bearish Crab that aims to be completed at 8450.
Sunday, June 9, 2019
WTI Crude Oil Elliot Wave ABC Correction
Looks Like WTI is currently making the corrective ABC of EW that aims to be completed between 53 tp 42 Level.
Saturday, June 8, 2019
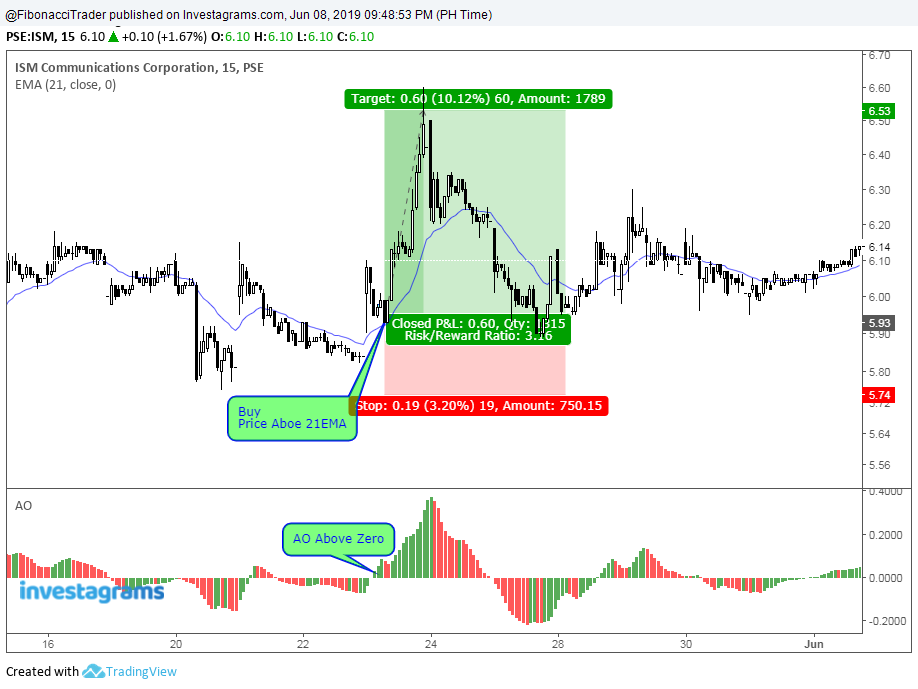
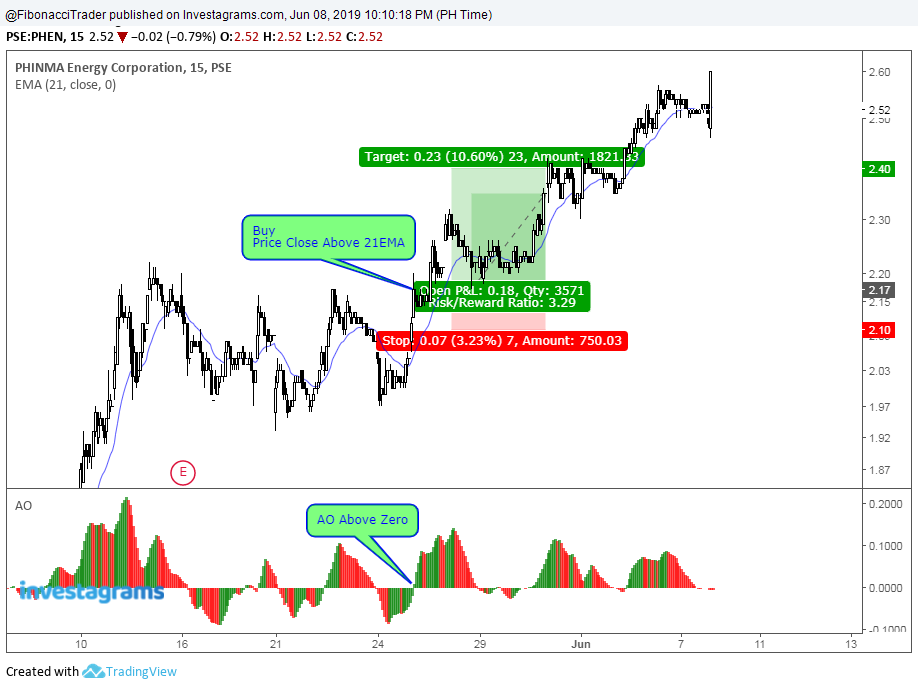
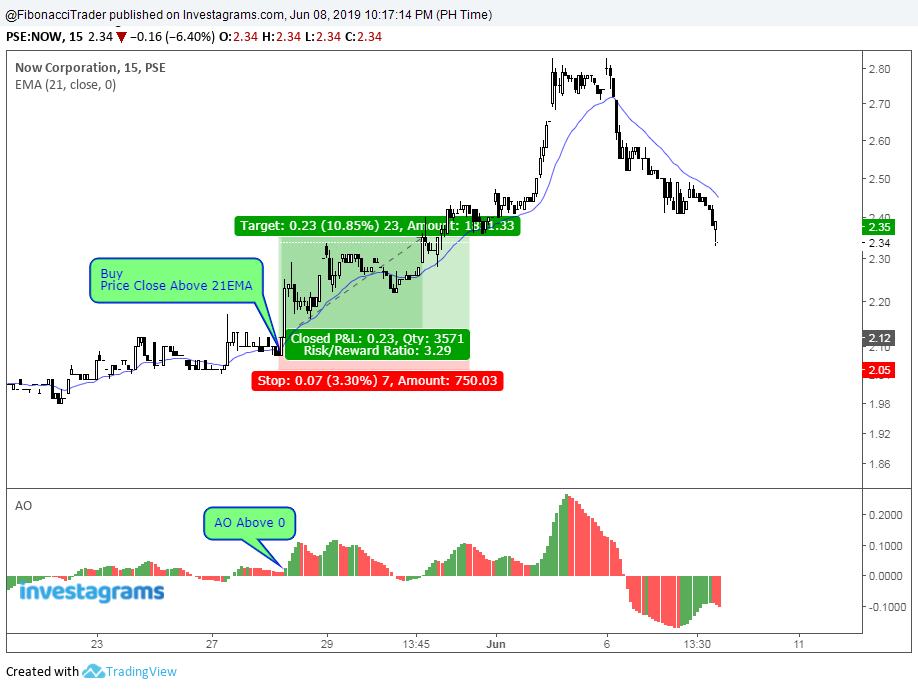
21 EMA & Awesome Indicator Strategy - Simple But it Works
Moving average is very effective in Stock market and in this strategy we have used 21 moving average with Awesome Oscillator. Both indicators indicate about market trend and help to identify trend direction easily. In this strategy, you will learn how can you find trading signals using 21 EMA(exponential moving average) and Awesome Indicator. This strategy can be used for both scalping and intraday.
Required Indicators
1. 21 EMA (put value 21)
2. Awesome Indicator
Buy Setup Rules
* First market price needs to cross 21 EMA from lower to upper.
* When 21 EMA upside breakout complete, then look at Awesome indicator
* At the same time, if Awesome Indicator stay above 0.0 level, then open buy entry.
* Set Stop Loss 3%.
* First market price needs to cross 21 EMA from lower to upper.
* When 21 EMA upside breakout complete, then look at Awesome indicator
* At the same time, if Awesome Indicator stay above 0.0 level, then open buy entry.
* Set Stop Loss 3%.
* Set Taret Price 10%.
Timeframes: 15Min, 30Min, 1 Hour
Note: This is for the Momentum Stocks Only
Examples
ISM Communications (ISM)
Phinma Energy Corporation (PHEN)
Now Corporation (NOW)
Subscribe to:
Comments (Atom)
